
CLICK ON CHART TO ENLARGE
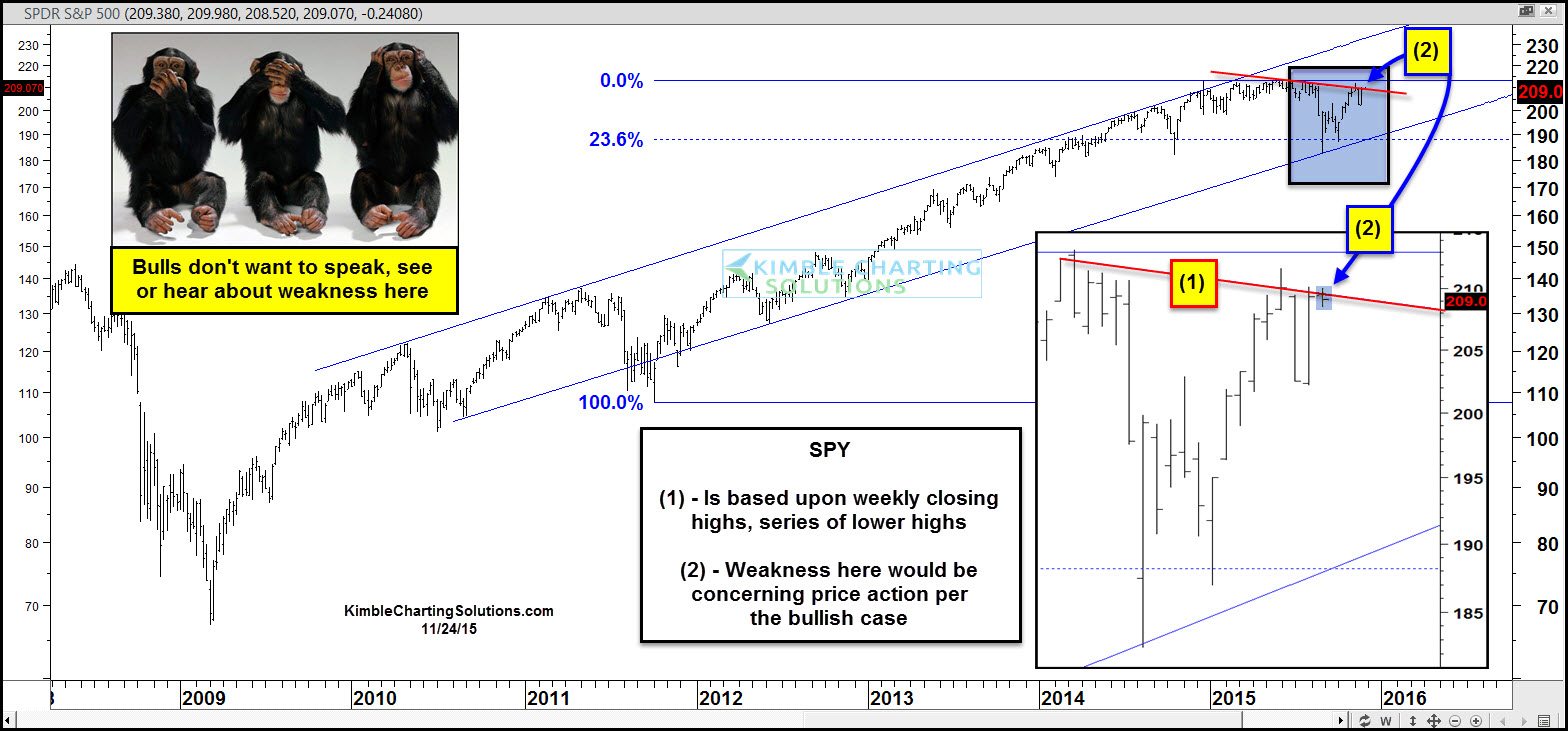
The S&P 500 remains inside of a rising channel that has been in place since 2010. The 5-year trend is up.
The 5-month trend is a different story, at this time.
Over the past 5-months, the S&P 500 has created a series of “falling weekly closing highs,” which is represented by line (1) above.
The S&P is testing this falling resistance line at (2) above.
If weakness takes place at (2) above, at falling resistance, it would be concerning price action for the bullish case!
–
