
I am fond of the phrase…”It’s not the odds of an event happening that is key, it’s the impact if it does!”
The S&P 500 peaked in 2000 and 2007. The time between these historical tops was 7-years and 7-months apart. Could the S&P 500 have created another key high, 7-years and 7-months apart, following the 2007 highs?
The odds of this are low, the impact would be high if its true.

CLICK ON CHART TO ENLARGE
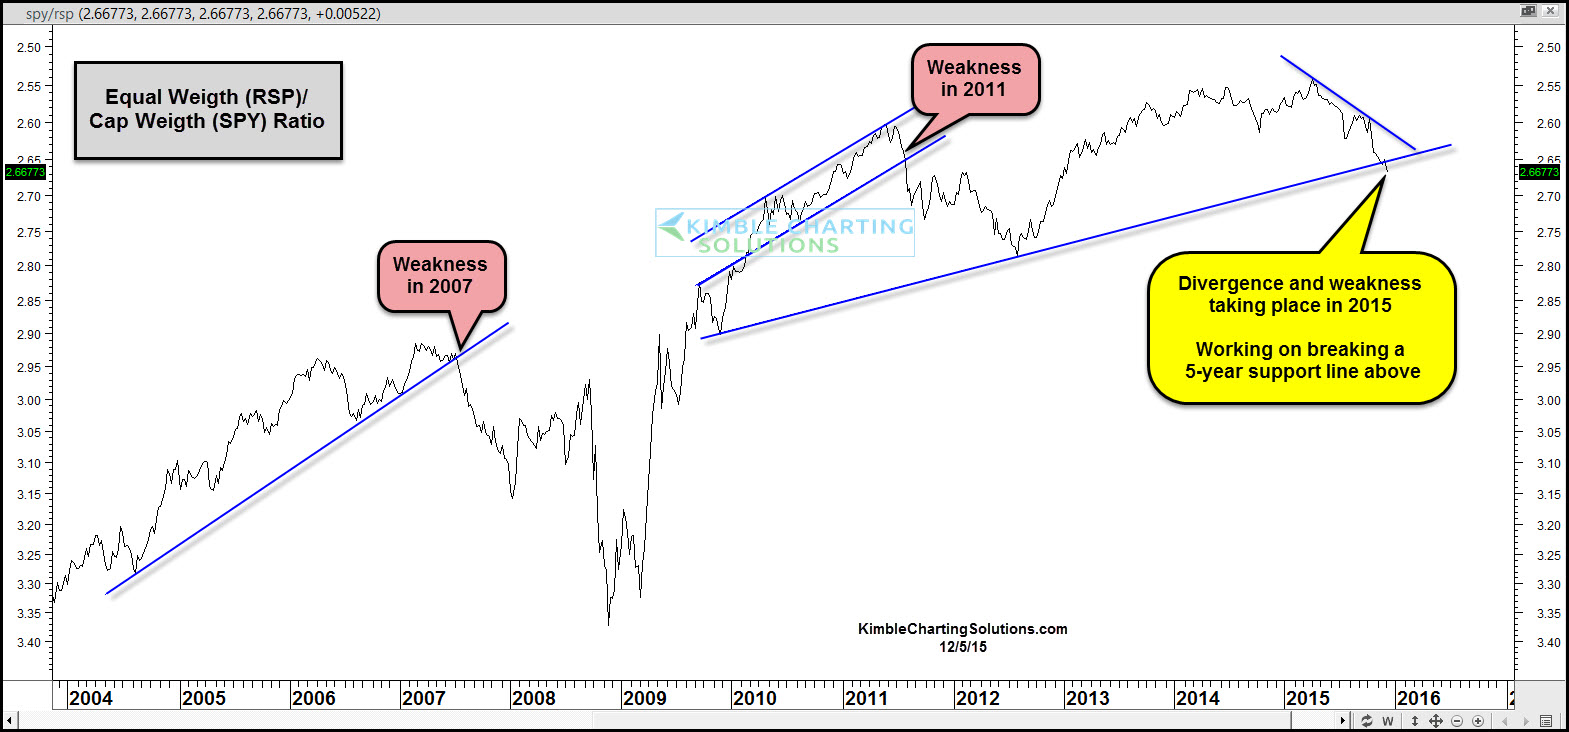
We keep our members informed of the ratio below, which we think is very important for the macro picture. The ratio below is the equal weight/Cap weighted S&P 500 ratio.
CLICK ON CHART TO ENLARGE
This ratio historically sends a bullish message when it is rising and at least a caution signal when falling. As you can see above, when the ratio broke support in 2007 and 2011, the broad market turned weak.
Since last year, the ratio has diverged against the S&P 500 and now its attempting to break a 5-year support line above. This softness is “at least” a caution message for the broad markets.
Did the S&P 500 created another top 7-years and 7-months apart? Still too soon to tell. Again, its not the odd of this being true, its the impact if it does.
We have been sharing these two patterns with our members for months. If you would like to stay abreast of these types of patterns and more, we would be honored to have you as a member. Click HERE or below to look at our membership options

–
