
CLICK ON CHART TO ENLARGE
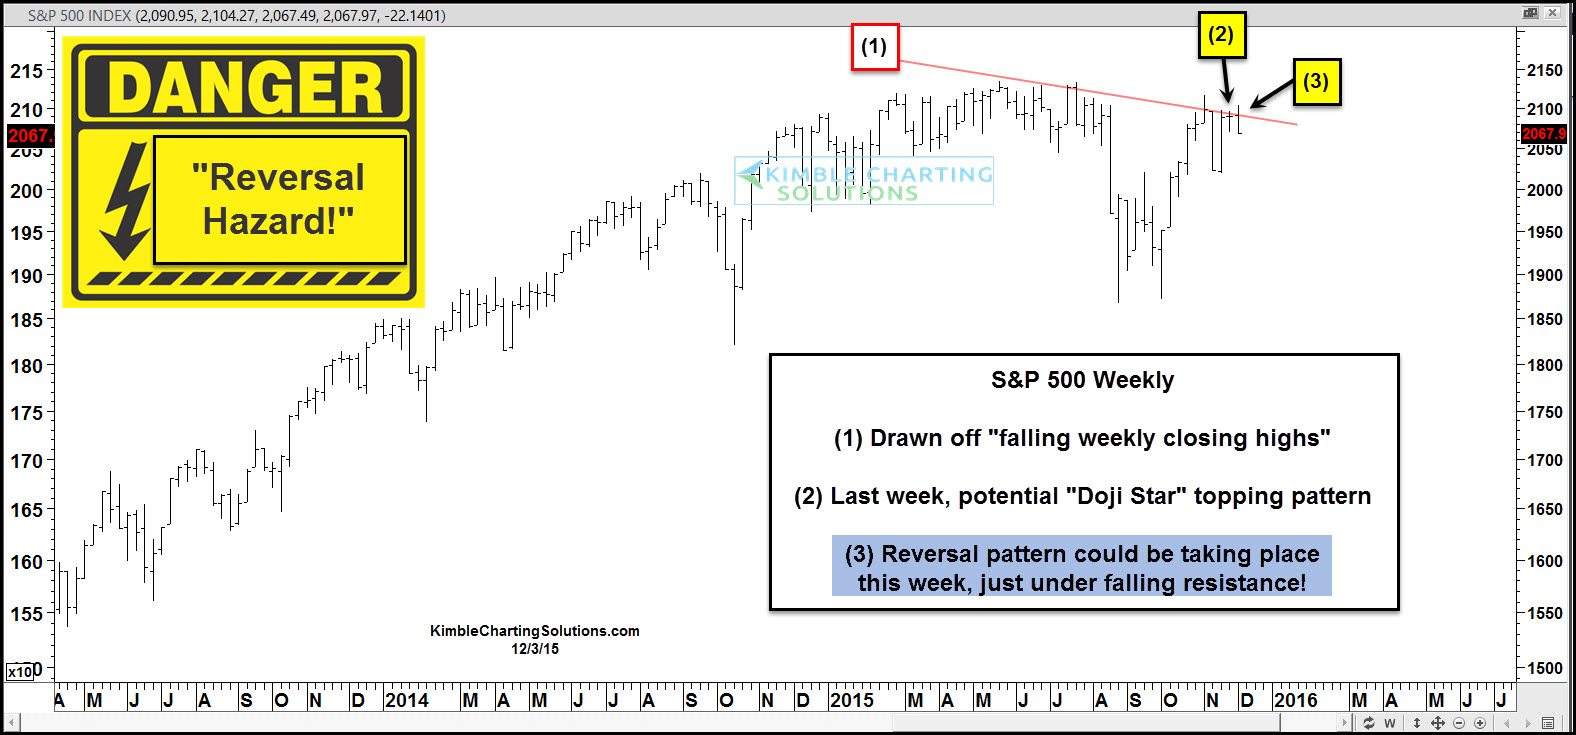
The S&P 500 for the past 5 months has created a series of “lower weekly closing highs” along line (1).
Last week the S&P might have created a “Doji Star” reversal pattern at (2).
This week a “reversal pattern” could be taking place at (3), just under falling resistance line (1).
The Power of the Pattern would put it this way….This has the potential to be a “dangerous place for a reversal to take place!”
We are in the positive seasonal time of year. For a repeat to take place, the first thing the S&P 500 needs to do, is break above line (1). If it can accomplish this, odds move WAY up that the seasonal trend will take place again this year!
–
