
CLICK ON CHART TO ENLARGE
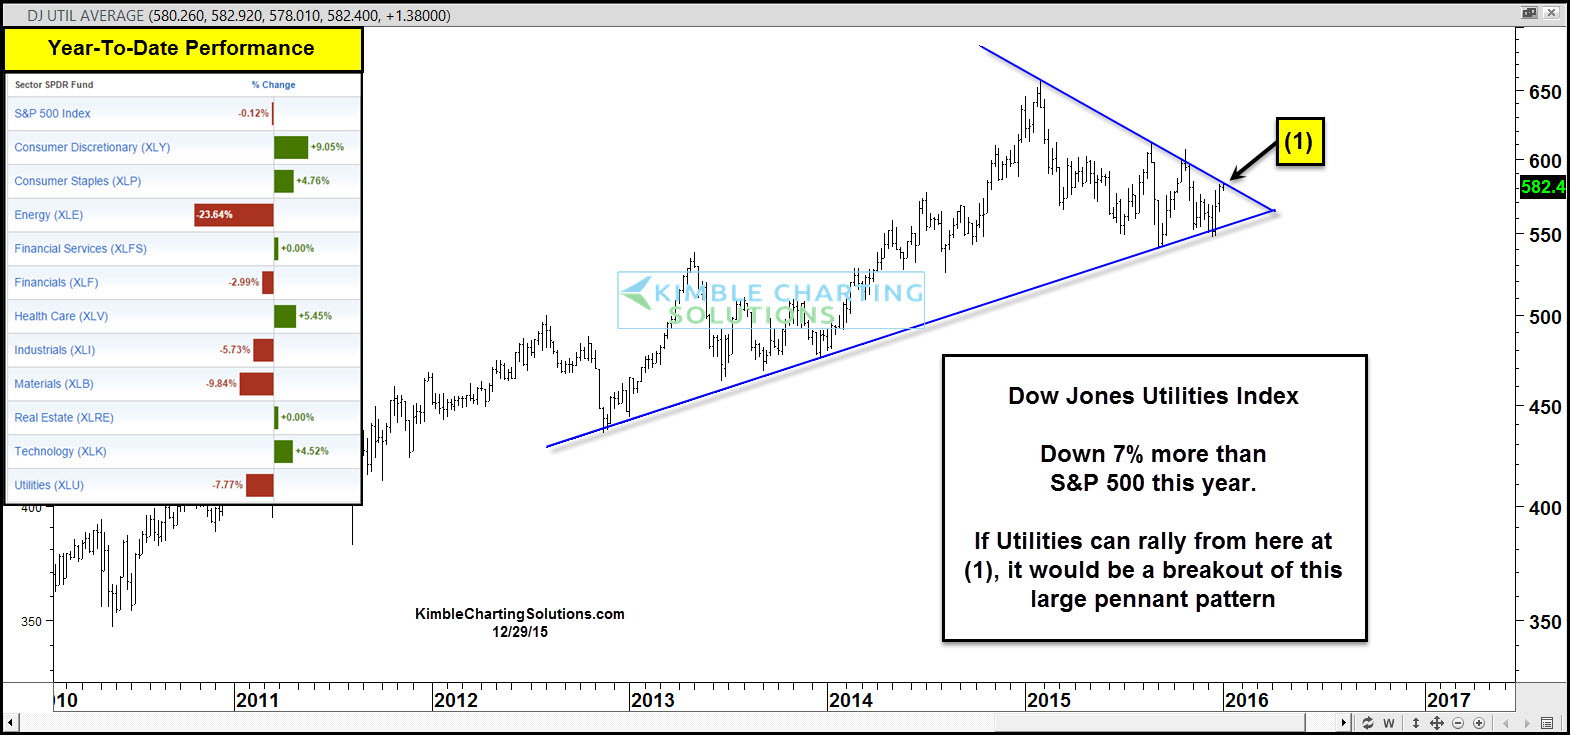
It’s been a rough year for the Dow Jones Utilities Index, as its declined 7% more than the S&P 500, so far this year. (See inset table)
While doing poor this year, the index has remained above rising support and has made a series of lower highs this year, forming a decent sized pennant pattern. Pennant patterns typically don’t tip off which direction assets will head. Historically its been a good ideas to follow breakouts or breakdowns of this pattern.
Yesterday we shared the S&P 500 has made a series of lower weekly closing highs, since July and was near falling resistance. The Utilities index looks the same, per it is facing falling resistance at (1) above.
A breakout at (1) would be a positive for the index and could send a positive message to the broad market as well.
Some really important tests of falling resistance are in play right now, which could have a large impact on where prices are a year from now!
–
