
CLICK ON CHART TO ENLARGE
Last week was rough for stocks, as the S&P 500 opened the year with the “worst first week of the year, ever!” The second week hasn’t been much to brag about, from the bullish camp, as prices have continued to fall.
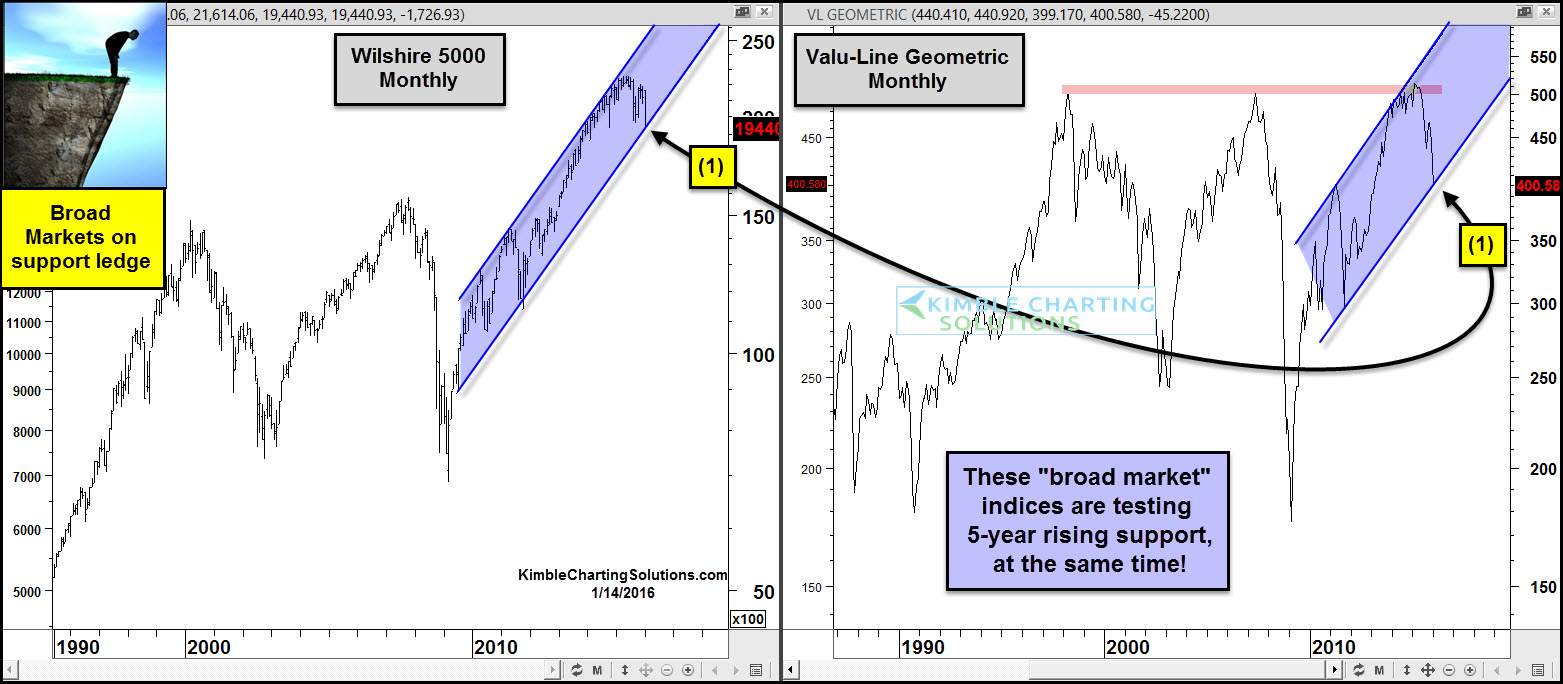
I wanted this morning, to take a long-term look at a couple of the broadest indices since the 1990’s. Today, I am highlighting the price action of the Wilshire 5000 and Valu-Line Geometric, on a monthly basis.
As you can see, each of these broad indices have remained inside of clean rising channels over the past 5-years. Both are testing rising support at the same time at (1) above. Despite falling prices in stocks since last years highs, long-term bull trends remain in play, as support is support until broken.
Bulls might want to get a little nervous, should these support channels break, since long-term support is a “pretty large percentage below trend support!” This is NOT a place where the bulls would want to see support give way!!!
Full Disclosure – Premium Members owned short positions in several markets, one of them that is really paying off of late is the Bio-Tech short. I am pulling up stops on short positions and doing some harvesting of gains at this time, due to these support test.
–

it´s the same situation as for the DAX at the present moment