
CLICK ON CHART TO ENLARGE
Gasoline futures have correlated with Crude Oil over the past 18-months, both have tanked.
Is the decline over with? Way too soon to tell.
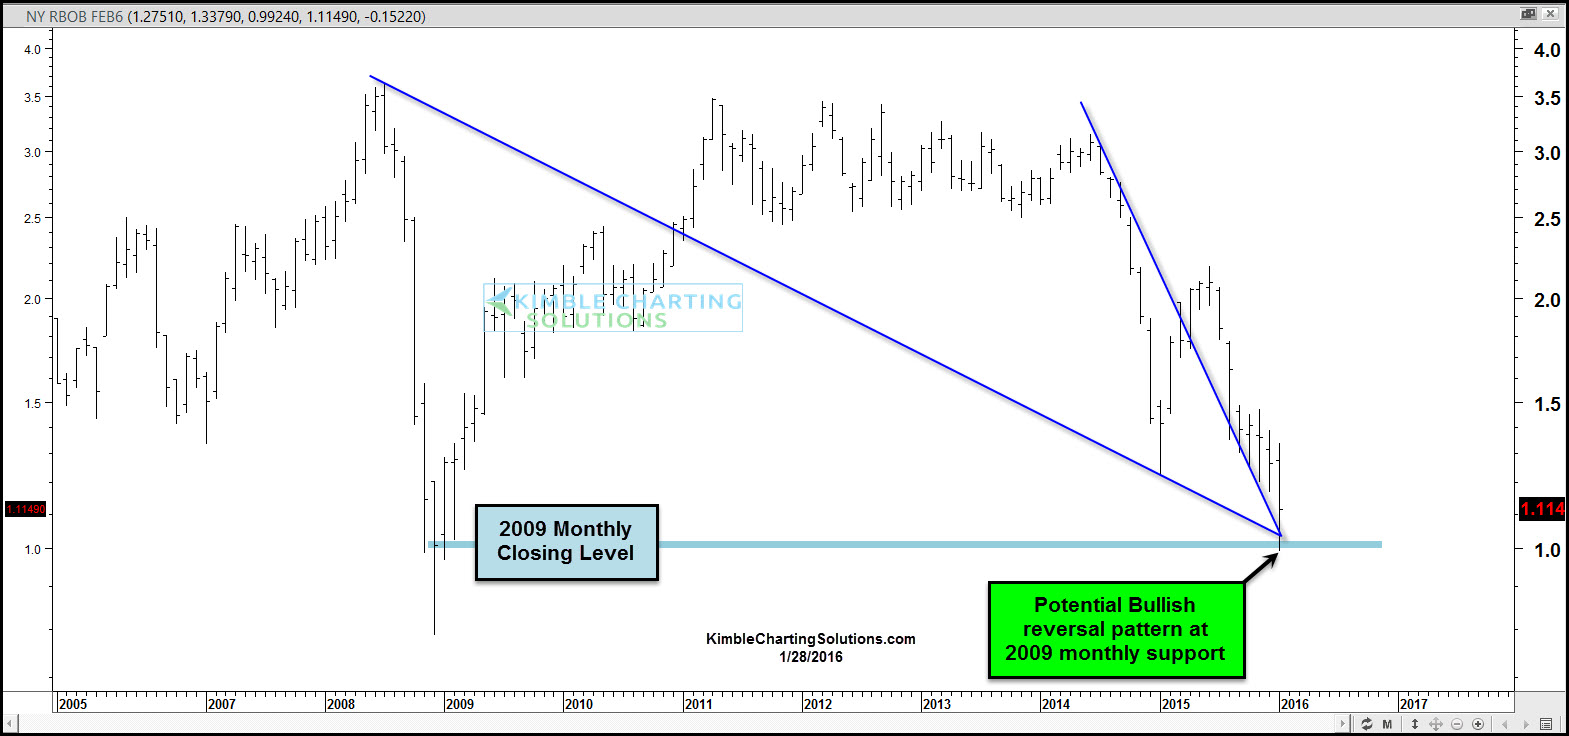
The above chart looks at Gasoline Futures on a monthly basis. The decline of late took gasoline futures back down to levels hit during the 2009 financial crisis. Gasoline closed at $1 level in 2009. Of late Gasoline fell to this level and has had a small bounce since.
The bounce could be forming a bullish reversal pattern (bullish wick) at the 2009 lows, while hitting two other potential support lines.
Crude & Gasoline futures are both attempting to create bullish monthly reversal patterns.
Could a rally in Crude and Gas, while the S&P 500 is testing 5-year rising support, be good for all three markets? Sure could!
–
