
CLICK ON CHART TO ENLARGE
Let’s start the week of with a “Macro Monday” perspective. The above chart looks back on the S&P 500 for the past couple of decades.
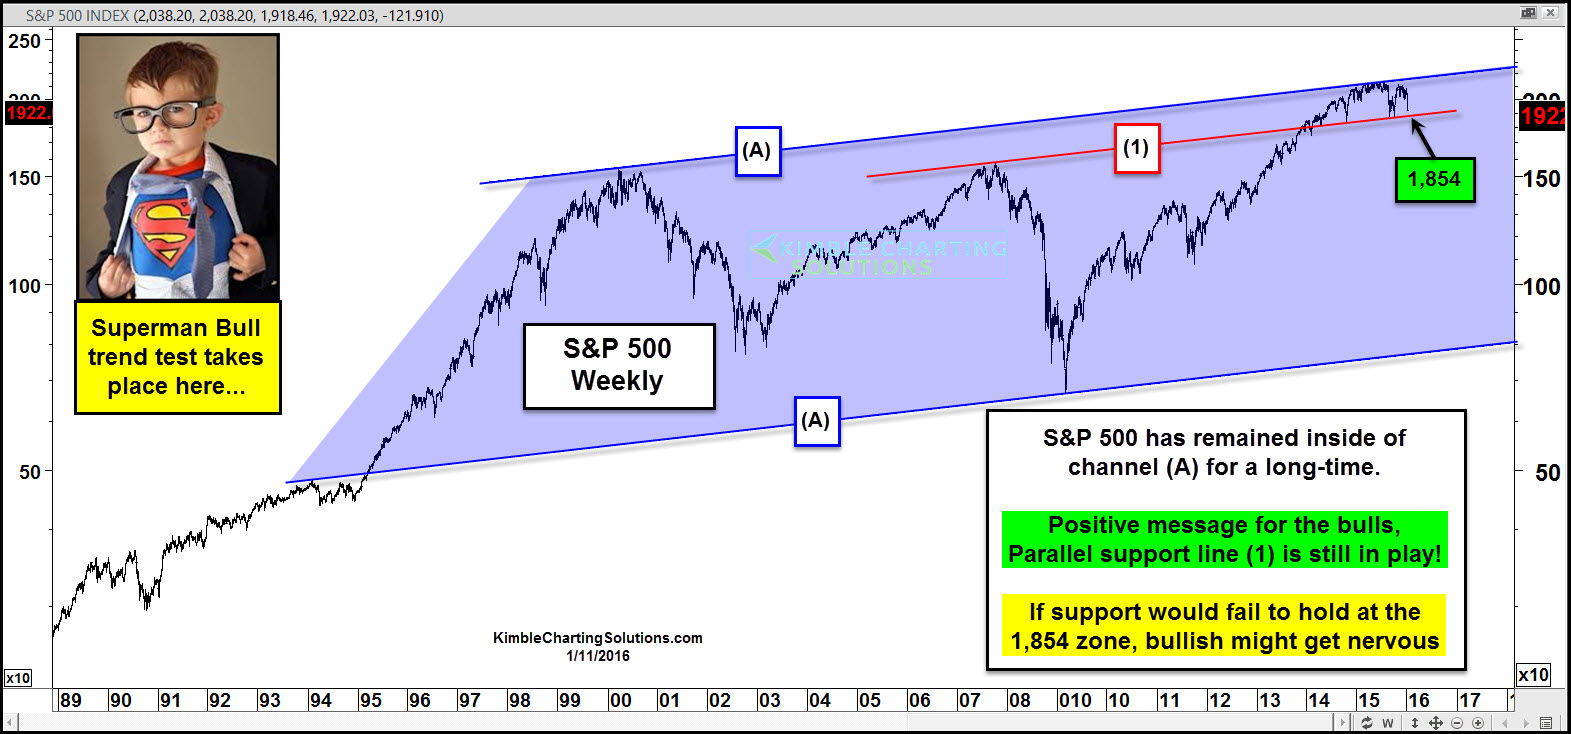
The S&P 500 has remained inside of rising channel (A) for a good while. If one placed this channel line (A) on the 2000 highs, the S&P last year hit this channel line and it stopped on a dime. So far this line has become stiff resistance since May of 2015.
Last week was the worst start to a year ever! First question that comes to my mind is this…”So What” So What does that mean???
Here is what means something to us from a Power of the Pattern perspective; Line (1) is a parallel to line (A). We placed it on the 2007 highs. Line (1) held as support during the “Ebola” panic in October of 2014 and it held again last year during the summer and fall declines.
Now line (1) could come into play again. This support line is currently in play around the 1,854 level. Support is support until broken.
If I was big time long, I would feel good that support line (1) is still in play.
If support line (1) is taken out and I was big time long, I would get a little nervous about my long positions.
If the S&P would fall around 3%, an important support test comes into play, in my humble opinion and what happens at this level, could impact buying and selling decisions on a global basis.
–
