
CLICK ON CHART TO ENLARGE
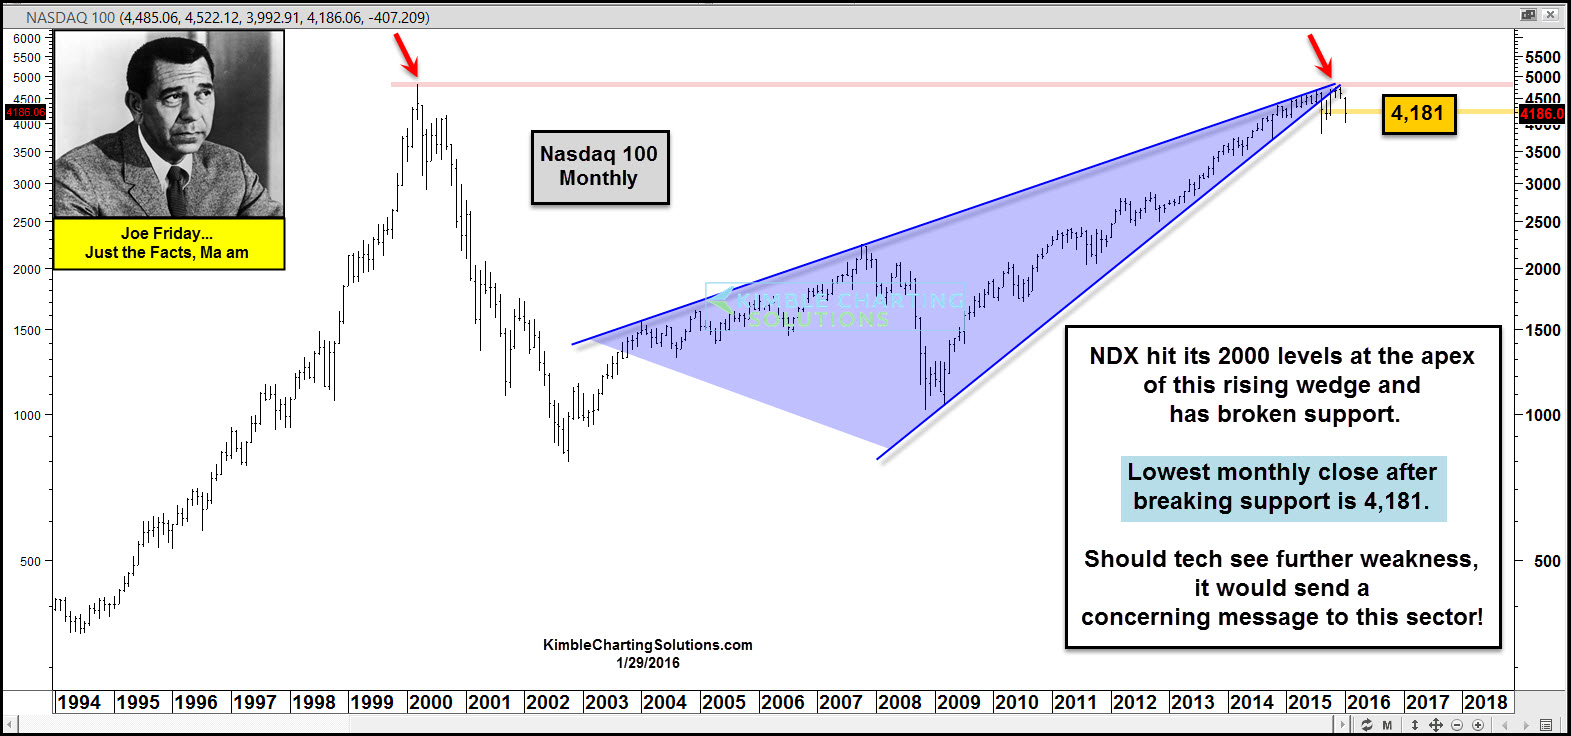
Today is the last day of the first month of the year. I favor monthly charts over weekly and weekly charts over daily. Wanted to take a long-term view of the Nasdaq 100 on a monthly basis on this last Friday of the month.
As you can see, the NDX rally off the 2002 and 2009 lows had it back to the highs it hit, at the peak in 2000. At the same time it was getting back to its 2000 levels, it was creating a well defined rising wedge and the apex of this wedge, came into play at the 2000 highs level.
Since hitting 2000 highs and the apex of the rising wedge, the NDX has broken rising support of the wedge. The lowest monthly close since breaking the wedge comes into play at the 4,181 level. Markets are up in pre-market trading, which would suggest that the NDX does not break below the lows set on 9/30/15.
With Tech testing such a key monthly price, I wanted to update what the weakest indices over the past 6-months looks like, see below.
CLICK ON CHART TO ENLARGE
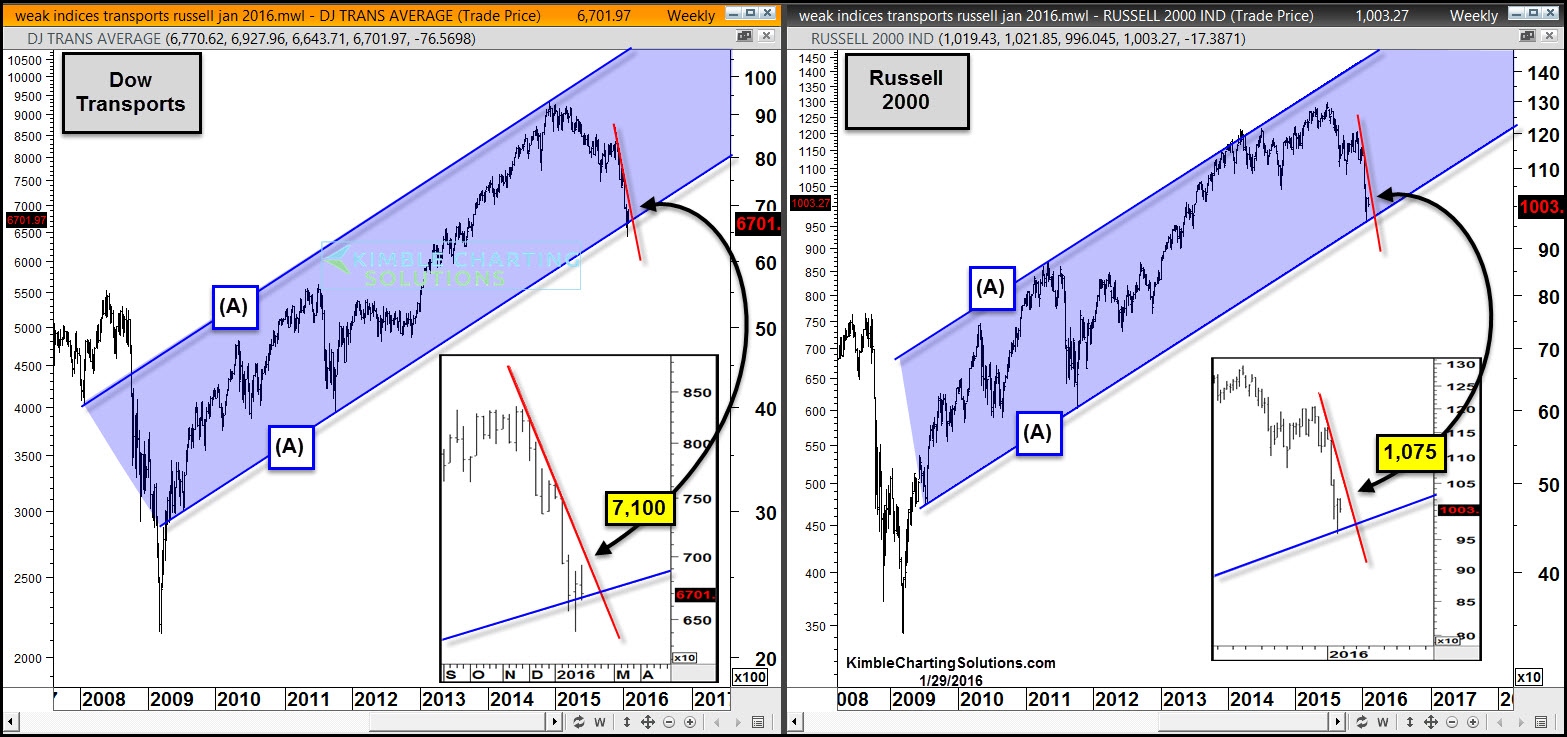
Transports and the Russell 2000 index have been leaders on the downside. The declines have taken each index down to 5-year rising channel support, which HAS NOT been taken out and support is support until broken.
Both have room to rally around 6-7% before hitting steep falling resistance. What the weak do at support and resistance remains very important in our eyes.
Joe Friday Just The Facts...NDX is testing monthly support at the same time as the weak indices (Transports & Russell 2000) are both testing 5-year rising support. Today is the last day of the week and month and where they close tonight, could be a little more important than usual!
We shared with members yesterday that the leadership ratio IBB/SPX broke below 5-year rising support. Bulls would want to be cautious if 5-year rising support channels are taken out by the weak indices.
–
