
One trend is clear, over the past 90-days, stocks have been soft. Below looks at what markets have been the weakest, during the past 90-days.

CLICK ON CHART TO ENLARGE
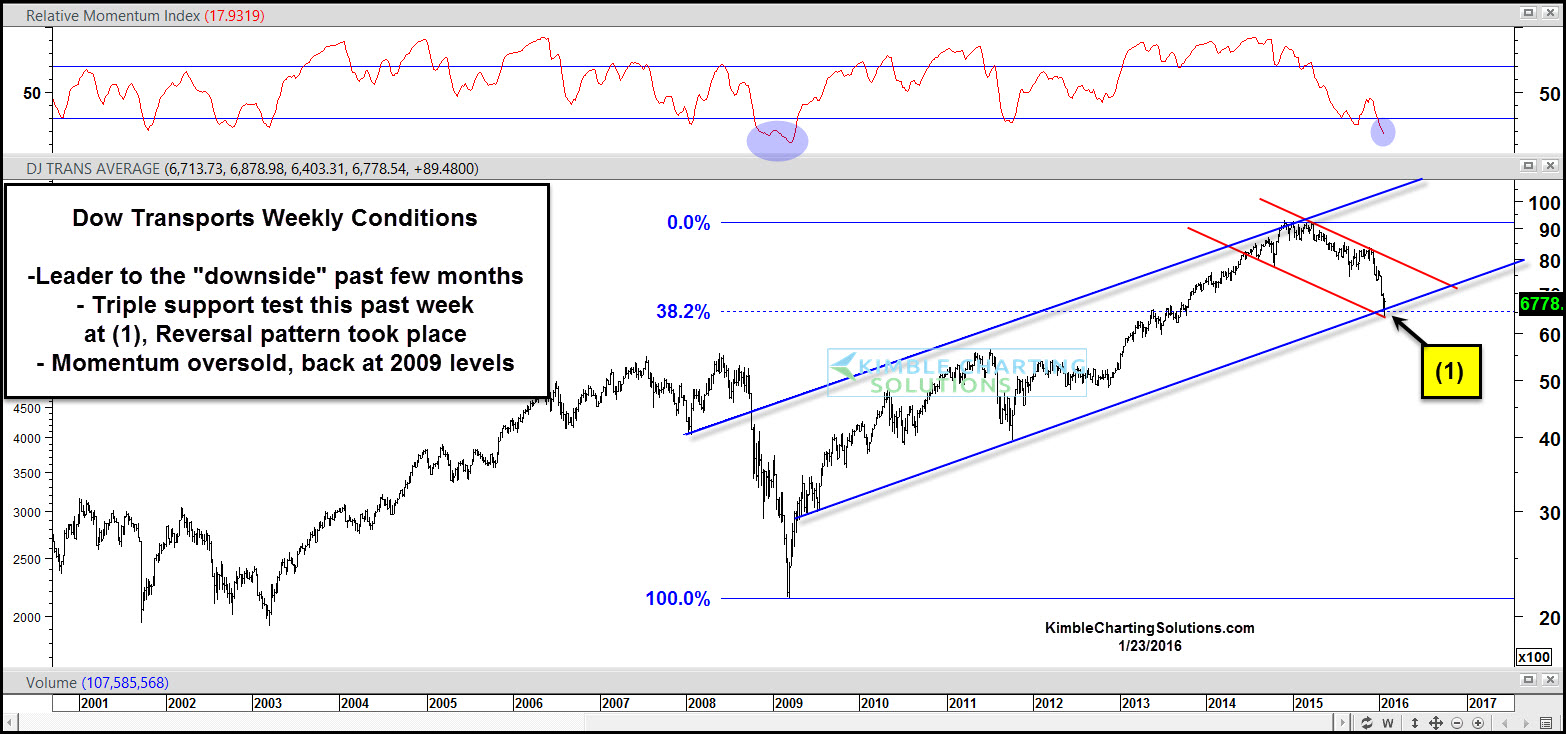
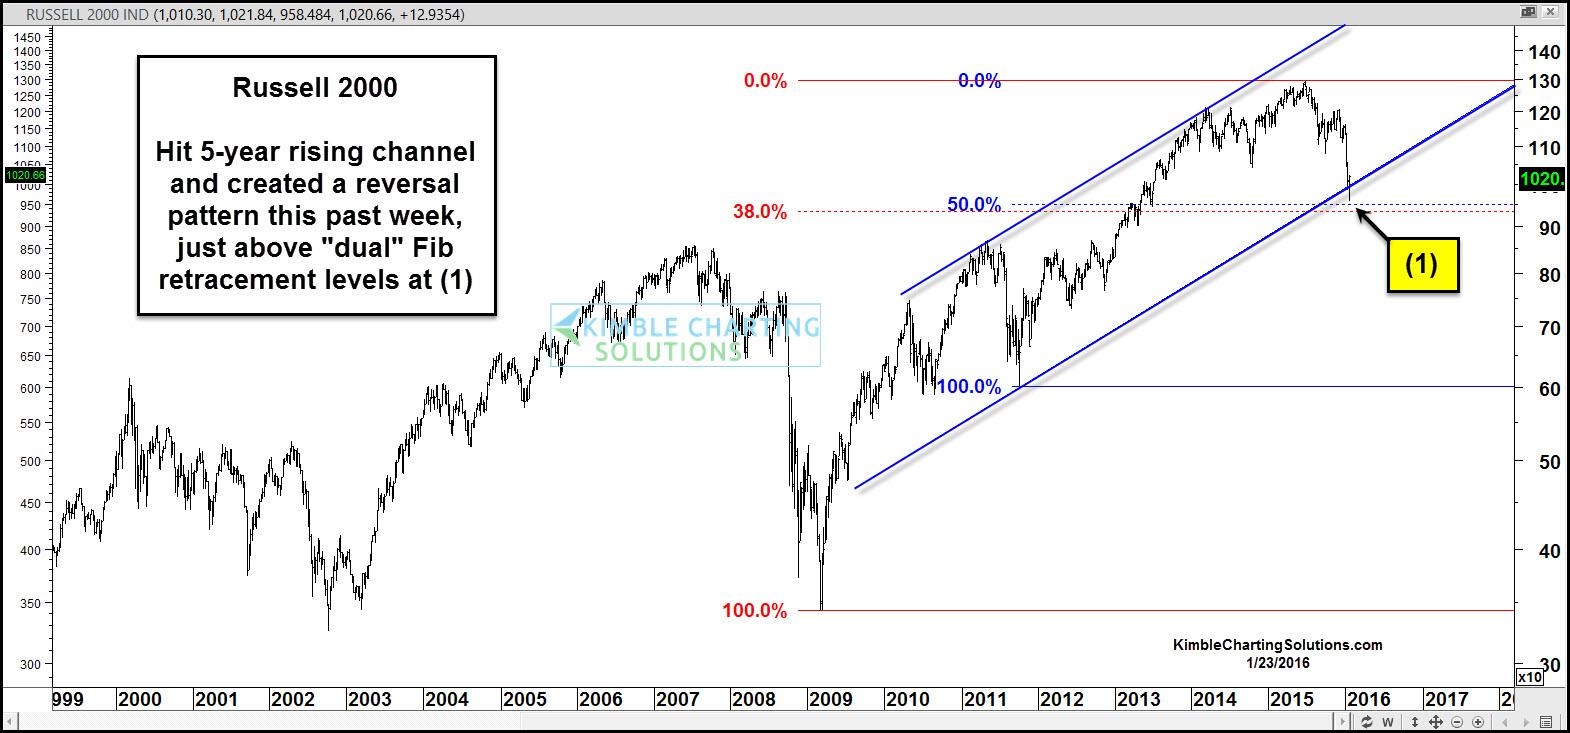
The two “downside leaders” are Transports and Small Caps (Russell 2000). So lets take a peak at what these two look like, from a Power of the Pattern perspective.
CLICK ON CHART TO ENLARGE
Transports 17% decline in the past 90-days, found it testing 5-year rising support this week and its Fibonacci 38% retracement level (based upon Financial crisis lows in 2009 and 2015 highs). At the same time weekly momentum is back at levels hit, at the 2009 lows. This week Transports created a reversal pattern (bullish wick) at dual support at (1) above.
CLICK ON CHART TO ENLARGE
Russell’s swift decline of late has put it testing 5-year rising support and it is just above two key Fibonacci retracement levels. This week while hitting dual support, the Russell index created a reversal pattern (bullish wick). Global stock markets this week, created the same reversal patterns as these two downside leaders did.
Bottom line…The 90-day trend is down.
If you were to create a wish list to buy any asset, what would be on that list? Would you want support to be in play? Would you want momentum to be oversold? Would you want sentiment to be hitting extremes? Would you want to see reversal patterns at support take place? Would you want bullish falling wedges to be in play? I would want EVERY one of these on my wish list!
Joe Friday, just the facts….One weeks bullish reversal patterns, at 5-year support, DOES NOT change the 90-day trend! Impressive “weekly reversals” patterns did take place last week, at long-term support, where you would want to see them from a wish list perspective. What took place and where last week, really has my attention.
I address many more key patterns, where we stand position wise and what two indicators are my determining tools of whether we should “buy the dips or keep selling rallies” in our weekly “Coffee With Chris” report.
If you would like a complimentary Coffee With Chris report, send us an email to [email protected] and we will have it in your email box Monday by noon eastern.
–

thanks for the complimentary Coffe With Chris report, i will look carefully
i like what i see so far –will try to sign on when i return from my trip
Please allow me a complimentary Coffee report. Thanks!
please send complimentary copy of Coffe with Chris report. Thanks
please coffie with Criss report
Thanks…love coffee and looking forward to having it with Chris. Thanks Very Much!
Please send me the Coffee with Chris report. Thanks.
Please send “coffee with Chris”report .
thank you
Please send me a complimentary Coffee With Chris report.
Thanks.