CLICK ON CHART TO ENLARGE
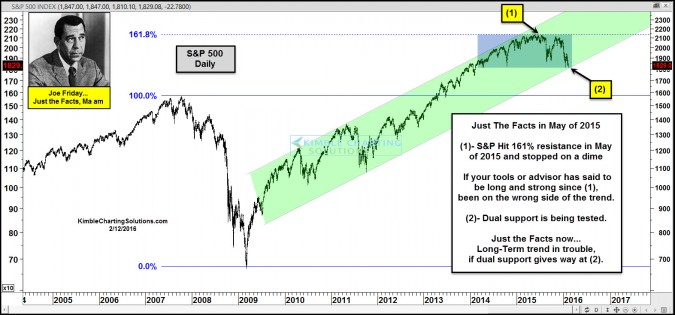
In May of last year, the S&P hit a key level and stopped on a dime. We applied Fibonacci tools to the highs in 2007 and the lows in 2009, to the chart above. The 161% Fibonacci extension level came into play in the 2,150 zone last year, and when hit at (1), the markets stopped on a dime.
If your tools or adviser has suggested to be long and strong since May of 2015, that advice has been costly.
Our take, “Free advice that is wrong, is expensive!!!”
Below looks at stock index performance since the 161% level was hit.
CLICK ON CHART TO ENLARGE
Joe Friday Just The Facts…The S&P on a daily Hi/Lo/Close is testing dual support at (2) above. Horizontal support has been in play for the past 2-years and rising channel support has been in play for the past 5-years. Joe says this is NOT your average test of support!
The Power of the Pattern suggested to members to pull back risk exposure last year. We are 100% open to buy dips at support. We humbly feel what happens at (2) above, will have an influence on the markets months from now, and for the long-term trend in stocks.
–


