

Warren Buffett’s company, Berkshire Hathaway has done a couple of rare things over the past year. One of them is under perform the broad markets and the other is, it looks to have formed a bearish “descending triangle pattern” over the past 14-months. See definition below from Fore-Tribe.com.
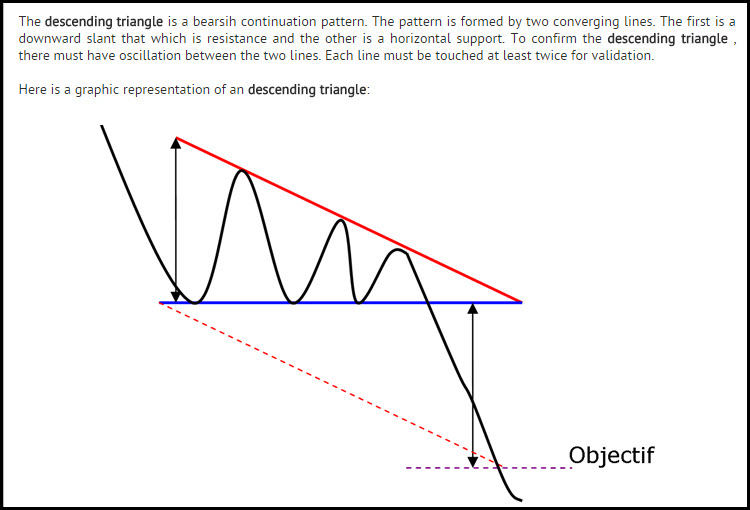
The main components of this pattern are; horizontal support and a series of lower highs. Below looks at Berkshire Hathaway over the past 20-years and the potential it has been forming a descending triangle over the past 14-months.
CLICK ON CHART TO ENLARGE
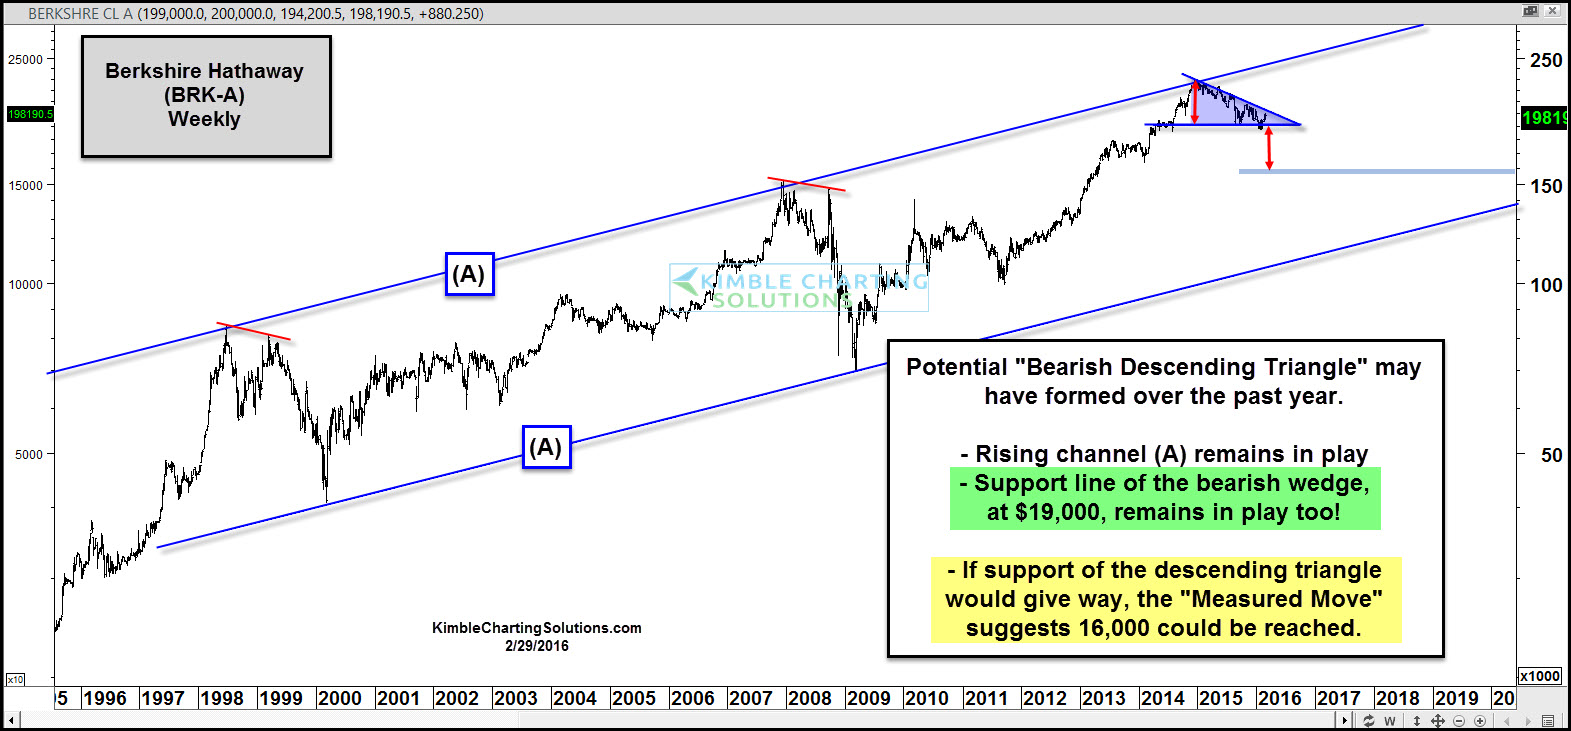
Berkshire Hathaway has been a stellar performer over the past twenty years, out performing the broad market by a large percentage. As mentioned above, BRK-A remains inside of a 20-year rising channel. For one of the first times in a long, long time, BRK-A has under performed the broad markets over the past 14-months. This under performance took place, after the stock hit rising channel resistance in January of 2104.
Since hitting channel resistance (A), the stocks has made a series of lower highs and a series of flat bottoms, forming what looks like a bearish descending triangle. Should BRK-A break overhead falling resistance, it would be good for the stock and it should run higher to test channel resistance again.
What to watch for, with a bearish descending triangle in play. Support at the 19,000 level,becomes very important for the stock. Should the support line be taken out, the “measure move” would then suggest sellers drive the stock to the $16,000 level.
In the late 1990’s and 2007, the stock created a series of lower highs and once support broke, sellers took control. As mentioned above, support is still in play and support is support until broken. BRK-A shareholders want support at the 19,000 level to hold and overhead resistance is taken out, so that this descending triangle pattern, doesn’t come true!
Speaking of Buffett, below looks at his valuation indicator.

Valuation indicator remains at lofty levels, 2nd highest level in past half century. See Buffett Indicator HERE
As you can see, when looking at valuations over the past 50-years, the markets remain at lofty levels, were only higher in 2000.
–
