
CLICK ON CHART TO ENLARGE
The chart above looks at the Nikkei index over the past 50-years.
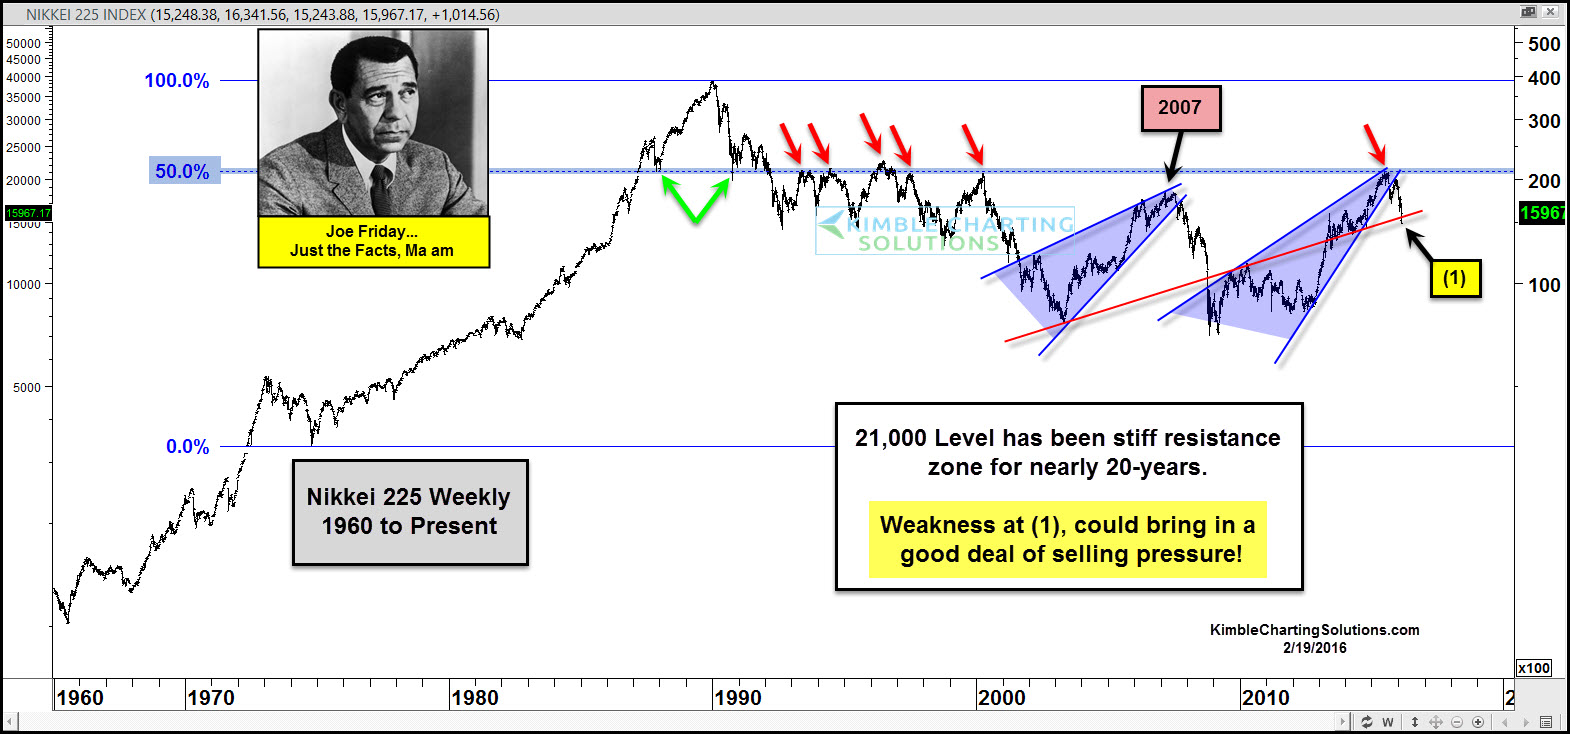
Around 25-years ago, the Nikkei broke below the 21,000 level and it has struggled to get back above it, for the past 20-years. This resistance zone has been tested numerous times and it has held its ground.
In 2007 the index neared this resistance zone at the top of a bearish rising wedge. Once support broke in 2007, the Nikkei and stock markets around the world, started heading south together.
Turning the clock forward, the Nikkei was within 200 points (1%) of touching this resistance zone last year, at the apex of another bearish rising wedge. It failed to break above this resistance zone again and has now broken below support of the bearish rising wedge pattern.
Joe Friday Just The Facts….Nikkei created another bearish rising wedge just under 25-year resistance last year and support of the wedge has been taken out. Further weakness in the Nikkei at (1) would create more selling pressure, which could cause the same thing in the states!
FYI- We have been sharing with Premium Members for months that the YEN could be creating a bullish inverse head & shoulders pattern, at 25-year rising support. If this read is correct and the YEN pushes higher, stocks around the world continue the 8-month trend of lower highs and lower lows. What the YEN does above the 87 level is BIG friends!!!
–
