

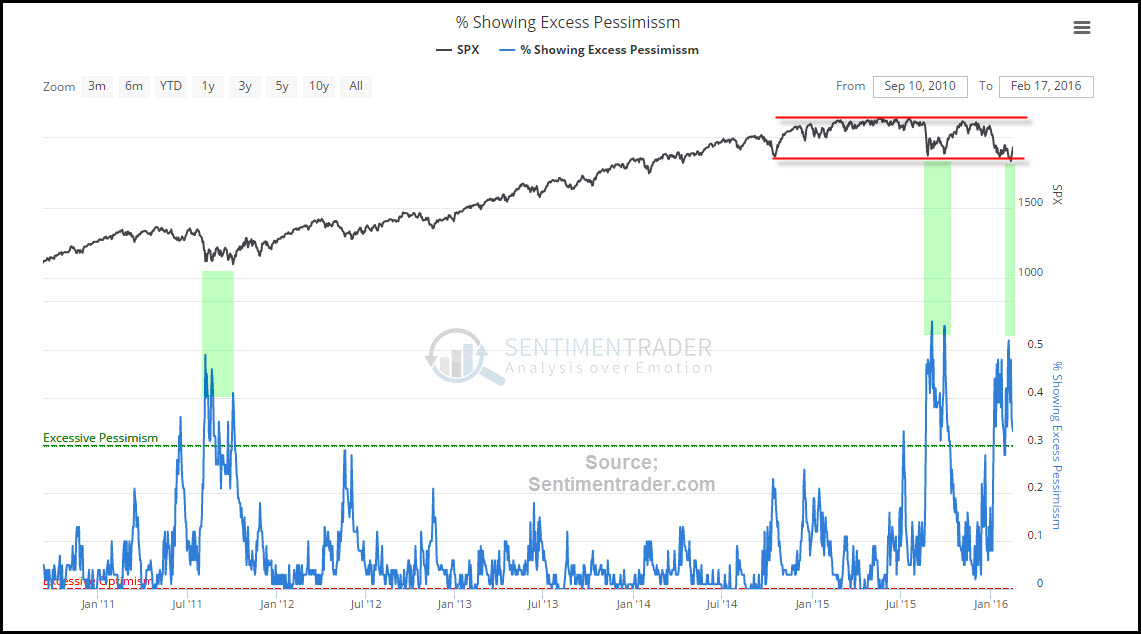
The declines in the stock market this year, has caused investor pessimism to move a good deal higher, hitting levels last seen at the 2011 lows (see table below)
CLICK ON CHART TO ENLARGE
The above table from Sentimentrader.com, looks at indicators reflecting “excess pessimism” since 2011. As you can see the declines since the November 2015 highs, has pushed the percentage of indicators showing excess pessimism, to levels last seen at the lows of last summer and the lows back in 2011.
The decline has caused many to speculate that the economy is headed into a recession or worse. What do you think about this subject? I will leave this debate, to the people that are much smarter than me.
Our take of the S&P 500 is reflected in the chart below.
CLICK ON CHART TO ENLARGE
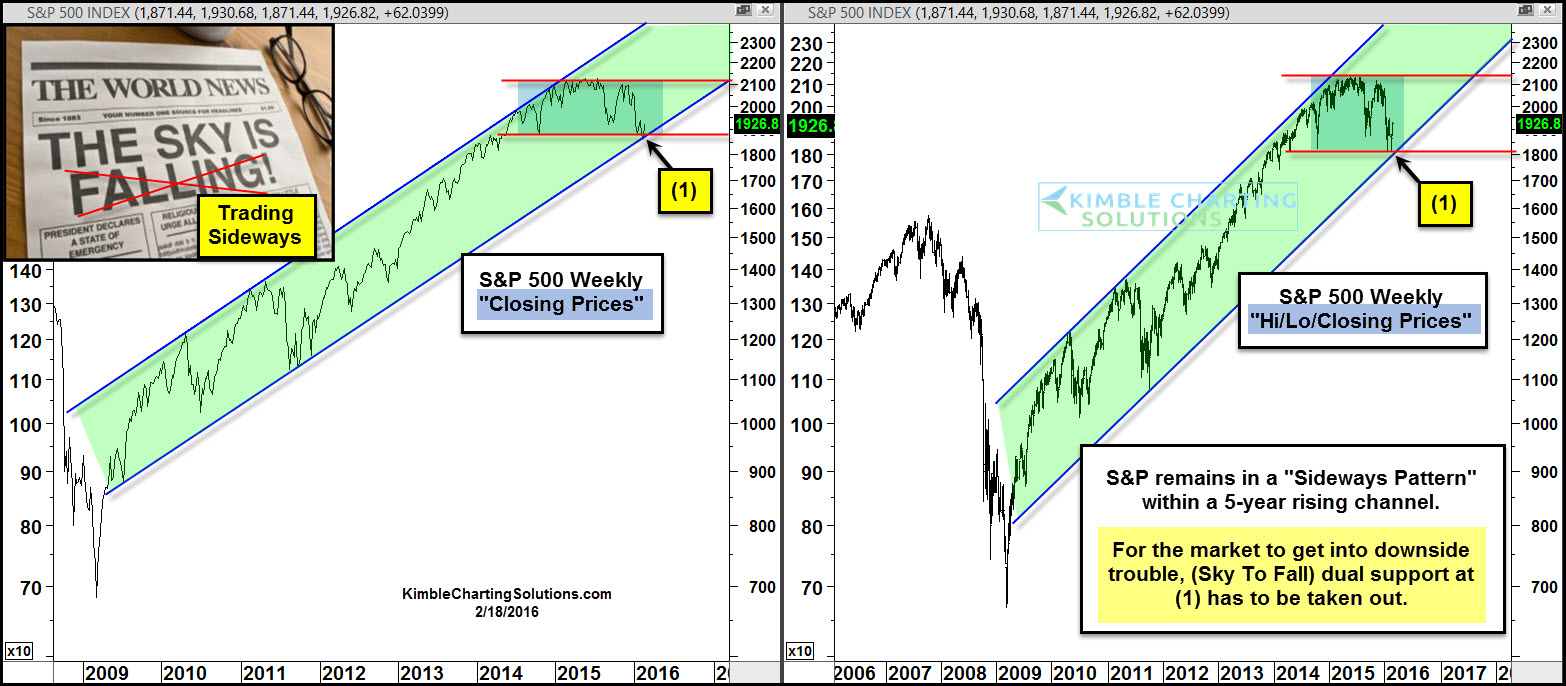
The above 2-pack looks at the S&P 500, on a “Closing Basis” (left chart) and “Hi/Lo/Close” (right chart). No doubt the S&P since last May, has created a series of lower highs and lower lows.
The Power of the Pattern take; These lower highs and lower lows, has taken place inside of a sideways channel, inside of a 5-year rising channel.
Dual support was hit last week at (1) above and so far it has held, as support is support until broken. Looking back on 2011, the S&P traded from the top of the rising channel to the bottom, over a 6-month time frame. When support was hit and pessimism shot up, the S&P continued it trend of higher lows and higher highs.
For the headline the “Sky is Falling” to come true, we humbly feel dual support at (1) has to be taken out first. Support remains in play around the 1,800 level and resistance take place around the 2,100 level. Until one of these levels are taken out, the S&P remains inside of a sideways pattern, inside of 5-year rising channels (higher lows and higher highs).
–

What service do you have available for someone who is interested in the equity markets and currencies but not commodities?