
CLICK ON CHART TO ENLARGE
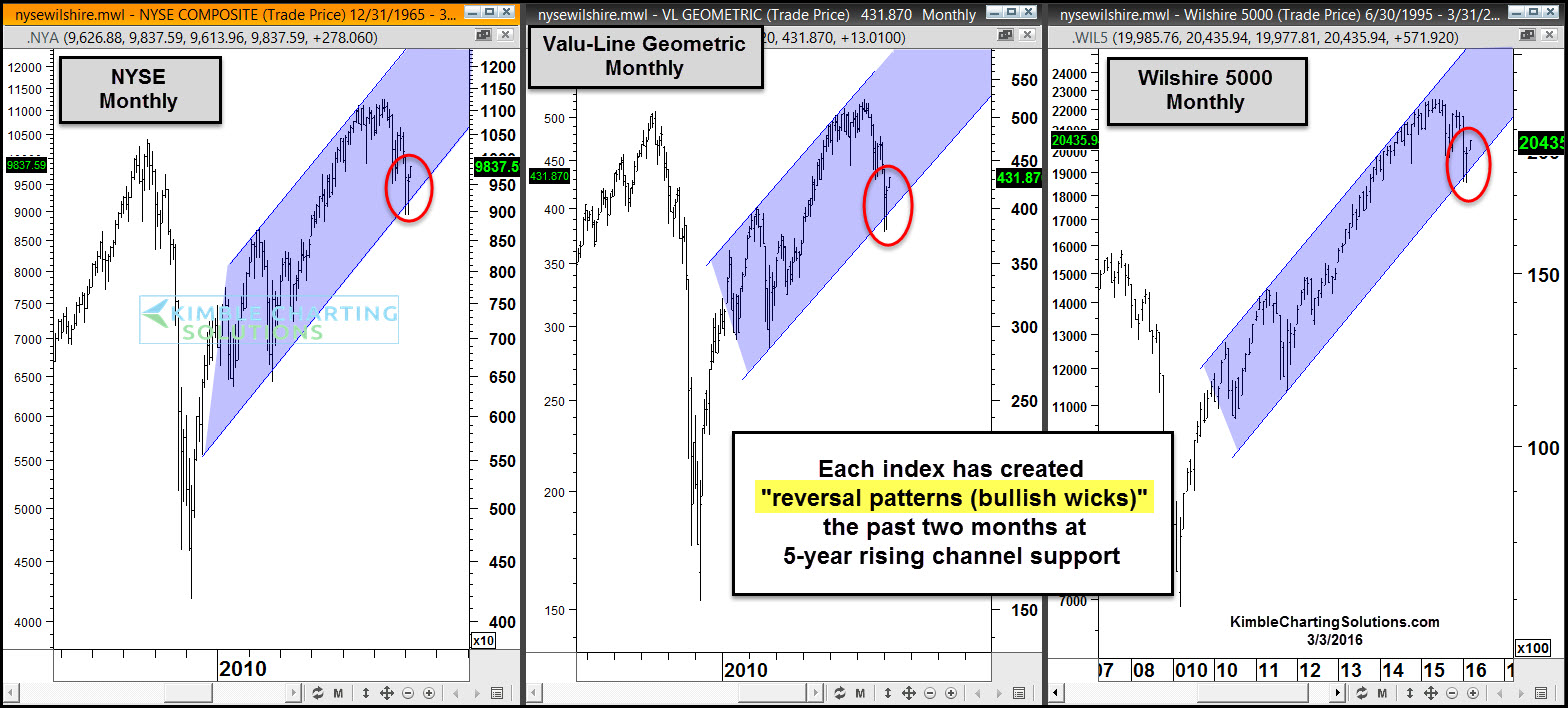
The 3-pack above looks at three very broad indices in the states. Each chart is based upon monthly prices.
Each index remains inside of 5-year rising channels and each has declined in price over the past year.
The declines in price, has taken each to rising channel support, testing to see if the 5-year bull trend in stocks, is to remain in play.
These charts are based upon monthly prices and over the past two months, each index has created bullish reversal patterns (bullish wicks) at 5-year rising channel support, which reflects that the long-term bull pattern remains in play.
From a 30,000 foot view, it is very important, that support remains in play and doesn’t break. If support would give way, it would send a message to stocks that we haven’t seen in the past 5-years!
Falling resistance, due to the lower highs and lower lows over the past year, is the next huge test, to see if the 5-year trends will remain in play!!!
–
