
CLICK ON CHART TO ENLARGE
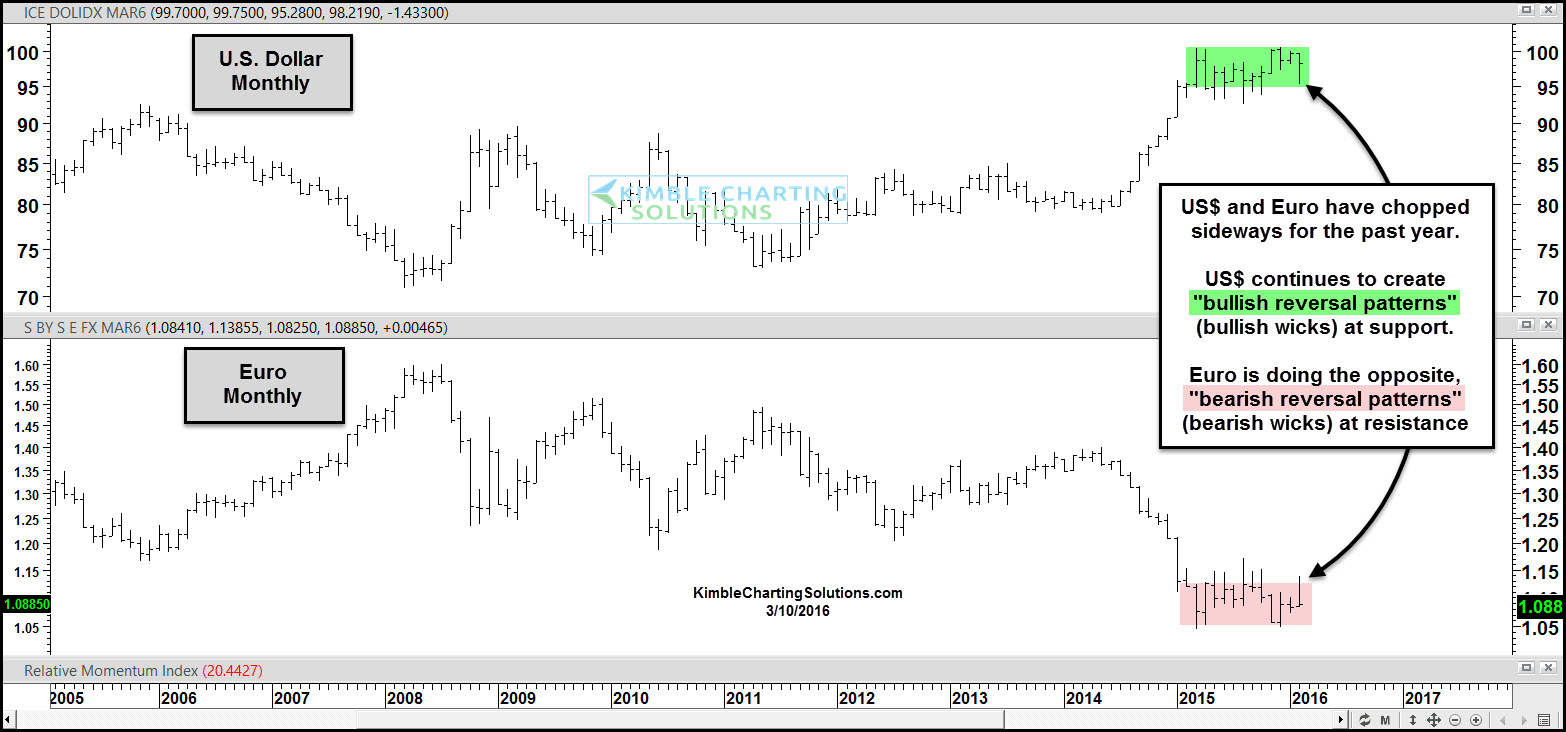
The chart above looks at the US Dollar and Euro, on a monthly basis, over the past 10-years.
Over the past year the US$ has traded sideways, after a strong rally. The Euro pattern is the opposite, trading sideways, after a large decline.
I do find this one issue interesting; the US$ as it hits support, it continues to create bullish reversal patterns (bullish wicks) and the Euro is doing the opposite at support. The US$ pattern suggests that buyers step in on weakness while at support and selling comes to the market when the Euro hits resistance.
US$ strength over the past couple of years has caused pain in the commodities space and some say hurt earnings of US companies that have large international exposure.
For this trend to change, the US$ needs to break support and the Euro needs to break resistance.
–
