

Below takes a look at the Valu-Line index over the past couple of decades. Could a “Triple Top” be in play in the broad based index?
CLICK ON CHART TO ENLARGE
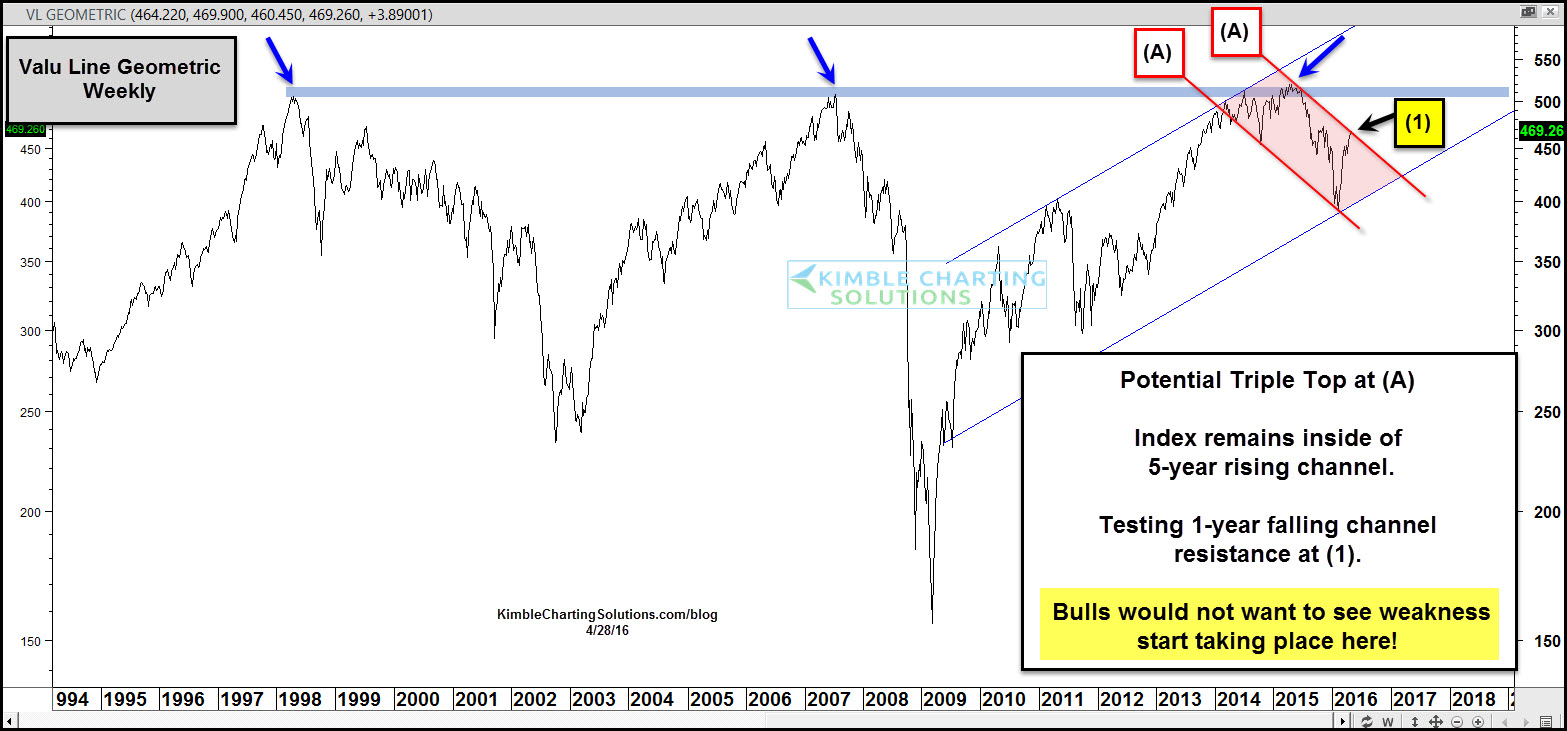
One year ago this week (4/24/15) the Valu Line peaked, as it was hitting the highs it reached in the late 1990’s and 2007.
Was this index influenced by the “Sell In May” theme one year ago this week?
Did a “Triple Top” take place a year ago? The jury is still out on this billion dollar question.
One thing that is for sure, over the past year, this index remains in a down trend, as it has created a series of lower highs and lower lows, inside of falling channel (A).
At this time the index is testing falling resistance at (1) and it is being presented an opportunity to break this down trend.
A key test of falling resistance is in play at (1) above. How this index handles falling resistance, should tell us a ton about where the S&P 500 heads over the next few weeks and months.
Since it is that time of year ago (Sell In May), this would NOT be a place that bulls would want to see weakness start creeping into the markets!
–

great stuff!