
CLICK ON CHART TO ENLARGE
The XAU Index is the oldest Gold & Silver mining index in the states, as it started keeping track of Gold & Silver mining stocks in the early 1980’s.
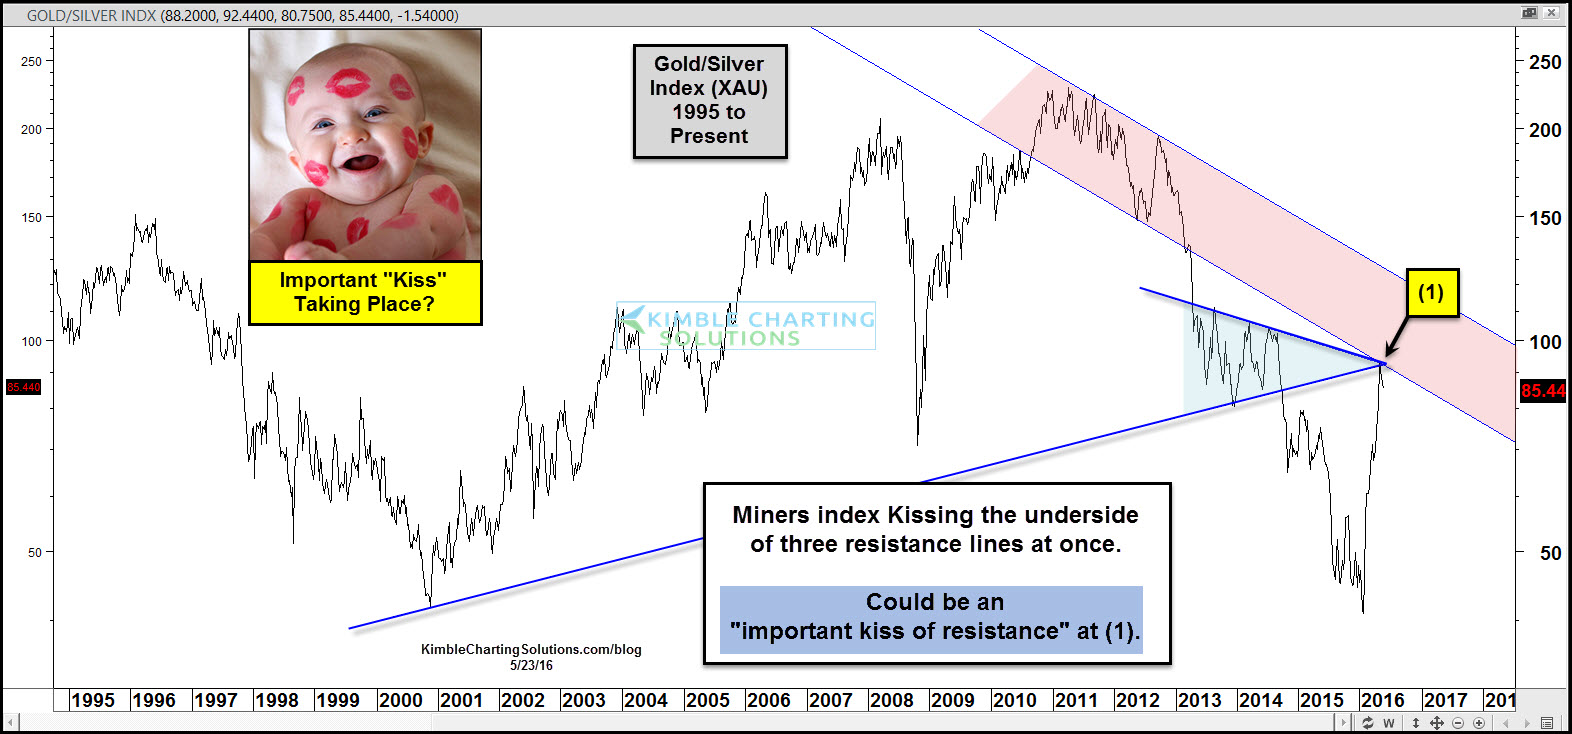
With this index having such a long history, it allows any of us to do pattern analysis going back 30-years. This chart looks at the XAU index over the past 20-years.
Miners have experienced a strong rally so far in 2016. This strong rally has the index kissing the underside of potentially three resistance lines at the same time at (1) above.
As we all know, coins have two sides to them. Bullish price action would result if mining shares can push higher and break above this resistance zone.
Concerning price action for mining stocks would take place if selling pressure started taking place at (1).
If you would like to stay abreast of the Power of the Pattern in Gold, Silver and mining stocks, see membership details and sign up HERE.
If you would like to receive pattern analysis on more assets, check out our “Triple Play Advantage” which covers more areas and offers deep discounts in pricing. For more details CLICK HERE
–
