
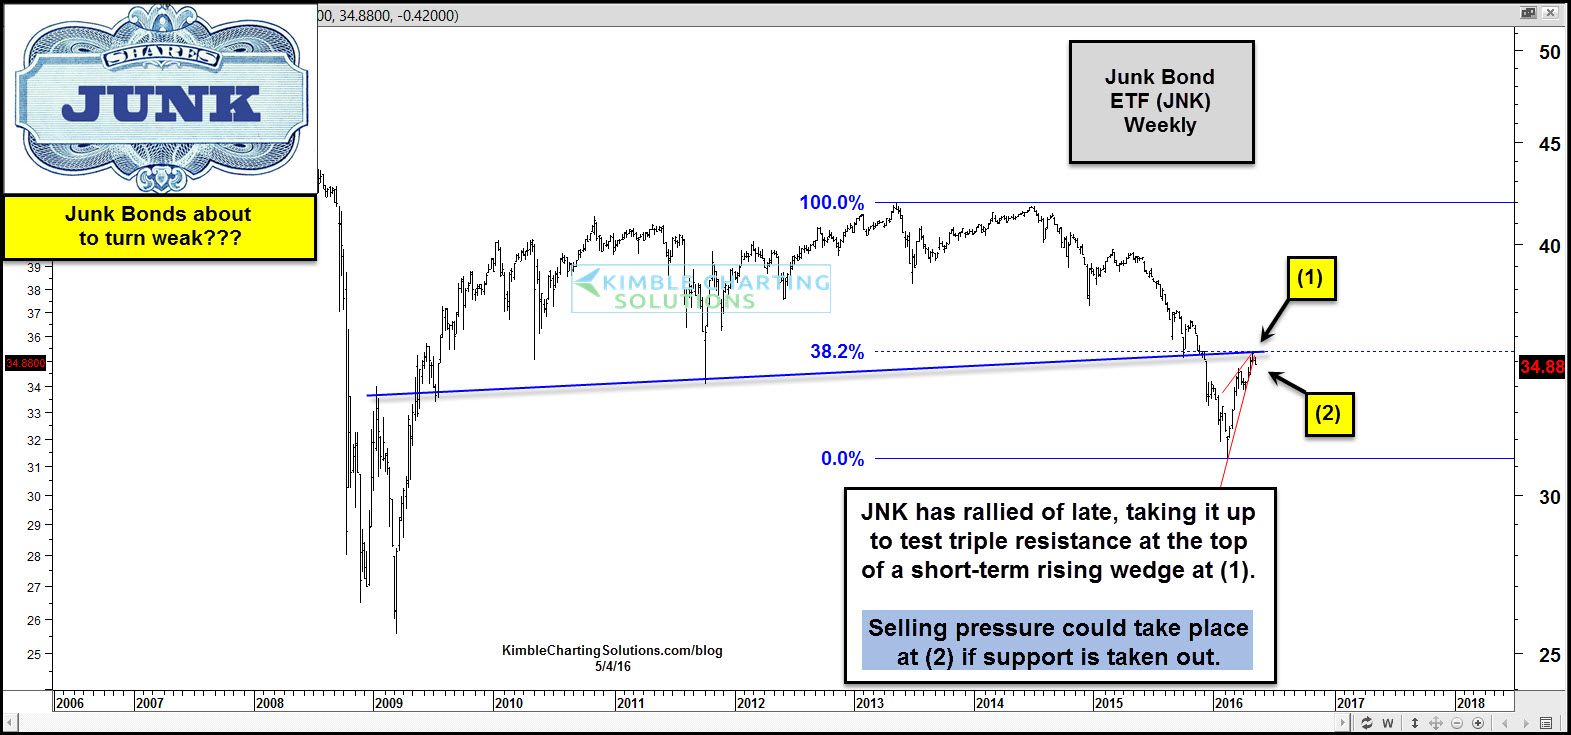
Many like to watch the price action of Junk Bonds, because they can send important messages about the strength or lack of in the stock market. Below looks at Junk Bond ETF JNK
CLICK ON CHART TO ENLARGE
As you can see, JNK looks to have created a double top in 2013 and 2014 and weakness in the sector soon followed. Once weakness really started to take place in this sector (2015), stocks didn’t have much luck moving higher.
JNK created a bullish reversal pattern (bullish wick pattern) the week of 2/5 and started turning higher. As JNK started moving higher, so did the broad markets.
Now JNK is testing a triple resistance zone at (1) above, with one of the resistance lines being the 38% retracement level of the 2013 highs and 2016 lows. Now JNK is near the apex of a short-term bearish rising wedge at (2) above.
Stock market investors might want to keep a close eye on Junk Bonds over the next few weeks, to see how they handle this resistance test.
Should weakness start coming back to this sector again, they could suggest that stocks have subdued returns for a while.
–

wow great chart. I also like your updates on GOLD too.
Do more on that please.
Have a look at the longer term chart of gold here => http://www.bit.ly/1TK77rs
That is an amazing chart, and historical. It means BIG THINGS ARE COMING for
currency and the ECONOMY. WOW!