CLICK ON CHART TO ENLARGE
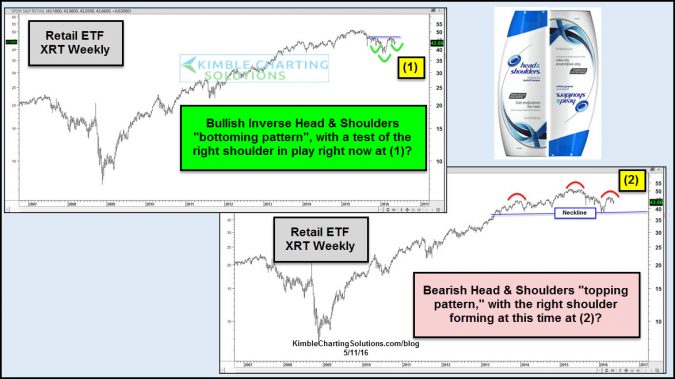
Is the price action of retail stocks meaningful to the broad markets? Does it tell us anything about the condition of the consumer in the states? Above looks at retail ETF XRT on a weekly basis.
The upper left chart reflects the potential that a bullish inverse head & shoulders bottoming pattern could be forming, with a test of the right shoulder in play right now at (1).
The lower right chart reflects the potential that a bearish head & shoulders topping pattern could be forming, with a the potential right forming at (2) above.
Rumor has it that the economy in the states is impacted by what consumers do.
If this is true, the patterns in XRT looks to be pretty important at this time, because which pattern is true, could highly impact portfolio construction going forward.
–


