

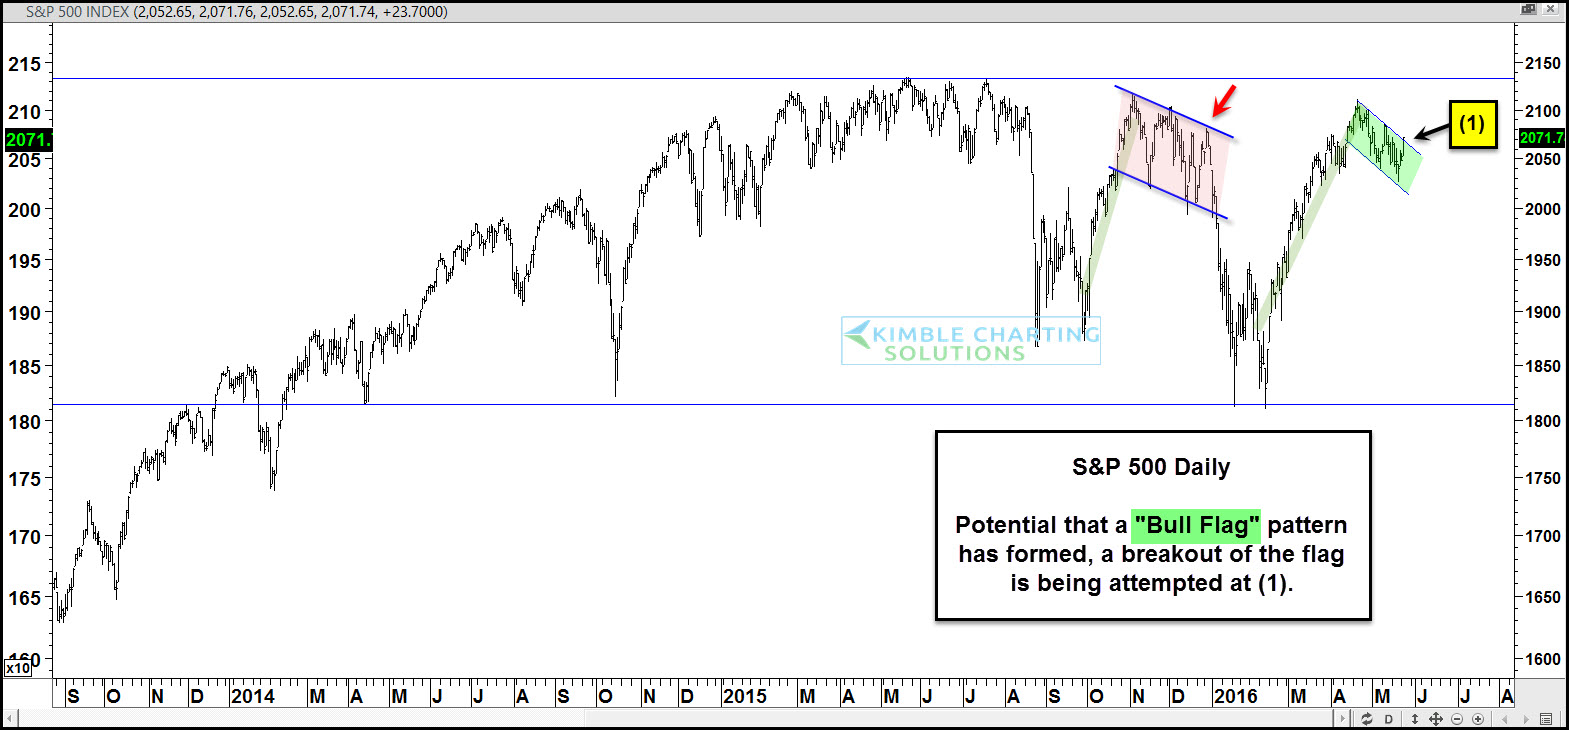
Has the S&P 500 formed a “Bullish Flag Pattern” and making an attempt to breakout? Possible. If you are not familiar with the pattern, see more details HERE.
 CLICK ON CHART TO ENLARGE
Unless one lives under a rock, you are well aware that that bulls nor bears have anything to brag about the past couple of years, as the market has continued to mostly chop sideways in a band between 2,150 and 1,800.
The S&P hit the bottom of the channel earlier this year and rallied strongly. Over the past few weeks the S&P has created a small series of lower highs and lower lows at (1) above. Last fall the S&P created a similar pattern and couldn’t find enough strength to breakout of a potential bull flag pattern.
Once resistance held, it fell hard for the next couple of months.
What the S&P does at (1), could tell us a good deal about where the markets stand a month from now. If the S&P breaks out at (1), it should attract some buyers. 2,150 zone remains much more important of a resistance zone, than the small falling channel at (1).
–

Now if it’s working well.
Sorry for the disturbances…
A greeting.
Ahora si está funcionando bien.
Disculpa las molestias…
Un saludo.
The link on the flag does not work properly.
El enlace sobre la bandera no funciona correctamente.