

How many of you like “Choppy/Sideways” markets? I humbly suspect that most don’t. They do present some short-term trading opportunities for sure, nothing wrong with that. From a trend perspective, I would understand if some think a sideways pattern is boring.
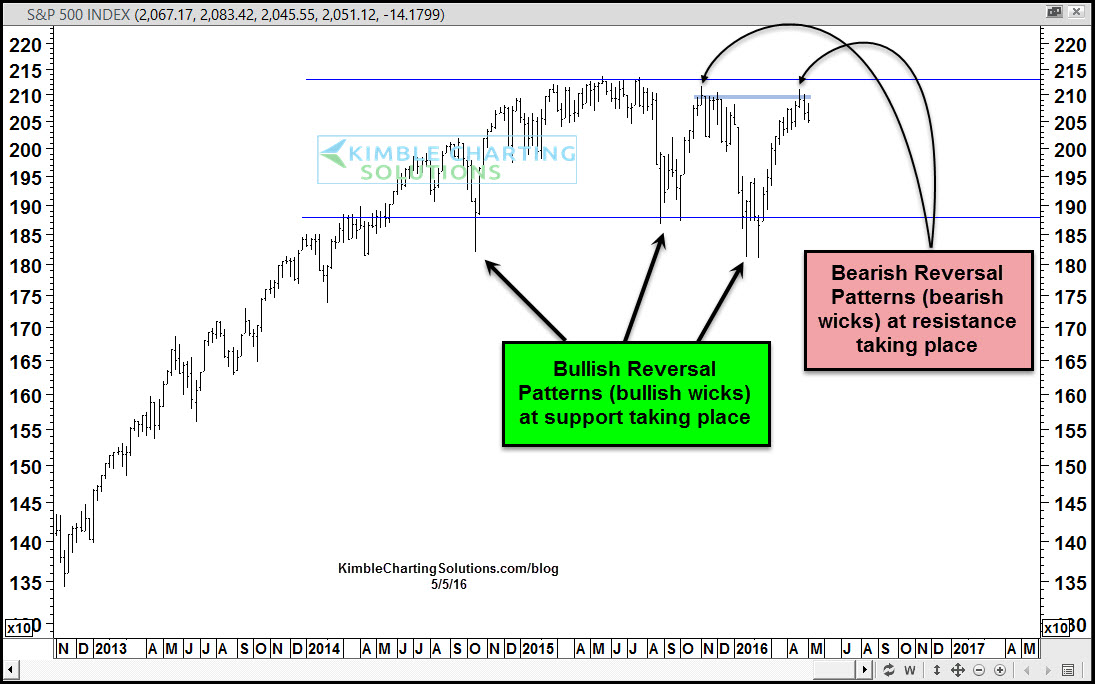
Below takes a close look at the S&P 500 over the past couple of years.
CLICK ON CHART TO ENLARGE
The S&P 500 has spent the last couple of years, forming this sideways trading range. Notice that near the bottom of the range the S&P has created bullish reversal patterns (bullish wicks) at support and the opposite has been happening the last two times (September of 2015 and two weeks ago) as the S&P was near the top of the range.

CLICK ON CHART TO ENLARGE
If one takes the 2007 highs and 2009 lows and applies Fibonacci Extension levels to these prices, the 161% extension level comes into play around the 2,150 zone. As you can see this zone remains the top of the trading range, after being hit in May of last year.
The sideways trading range remains in play and the last two times the S&P has been near the top of this range, a couple of bearish reversal patterns have taken place.
Even though these sideways patterns can be boring to the vast majority, one thing is great about them; the longer the sideways action, the bigger the potential when a breakout/breakdown takes place. This pattern suggests patience by investors until it is resolved.
–

Bearish