

CLICK ON CHART TO ENLARGE
The chart above looks at the Nasdaq 100 and the Nasdaq Fear Index (VXN) over the past 15-months.
The NDX 100 continues to create a series of lower highs since last fall. Falling resistance was hit at (1) of late, at the top of a small bearish rising wedge and support has been taken out.
At the same time the Nasdaq Fear index was near lows of the past 15-months of late. Over the past two weeks the VXN has pushed above a 90-day resistance line at (2).
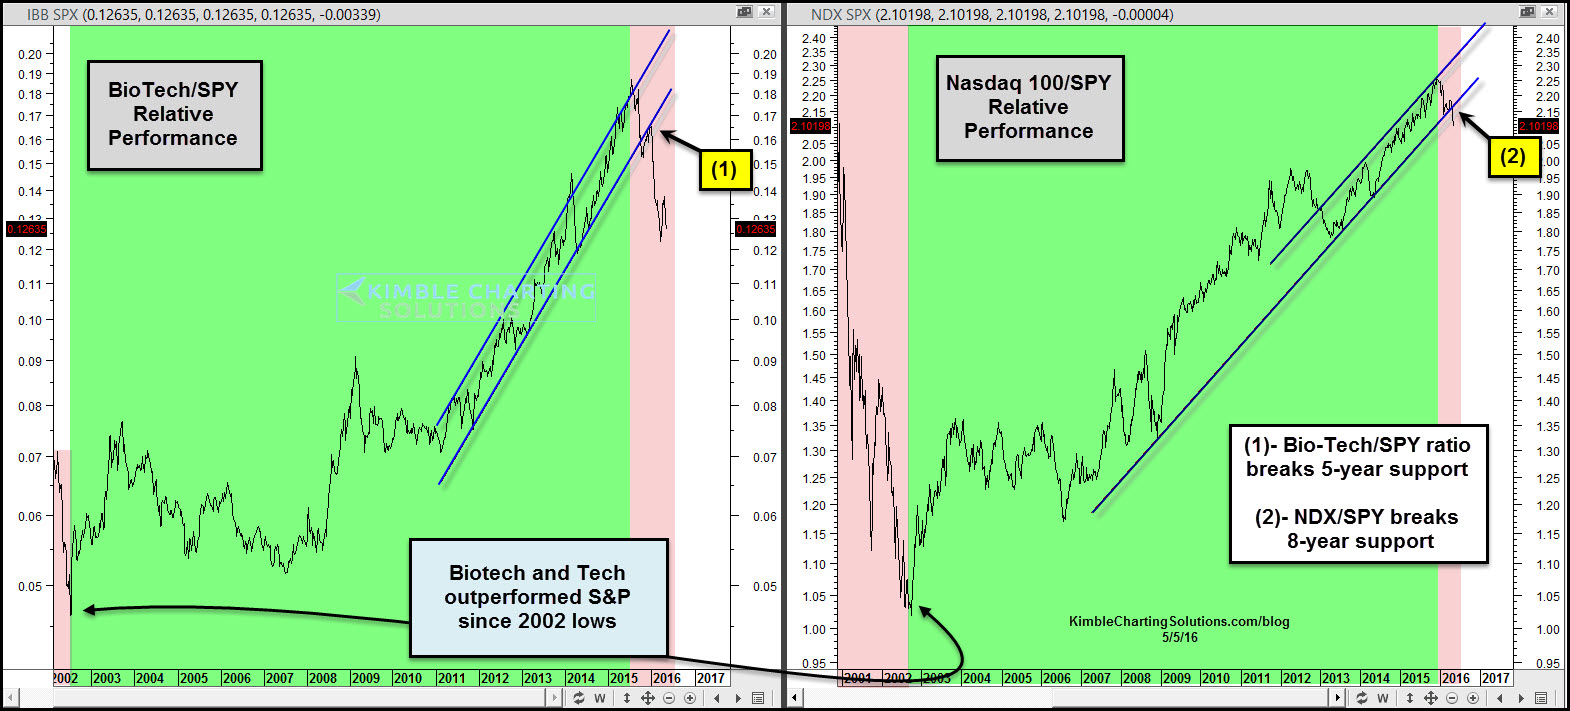
CLICK ON CHART TO ENLARGE
Bio-Tech and Tech stocks have been upside leaders since the 2009 lows, out pacing the broad market by a large percentage.
The above chart reflects that both have broken multi-year support lines, which suggests that these upside leaders could turn into downside leaders.
For the broad markets to push to all-time highs, bulls want/need Tech and Bio-Tech to act stronger.
Full Disclosure- Premium Members are short the NDX with a tight stop.
–
