
CLICK ON CHART TO ENLARGE
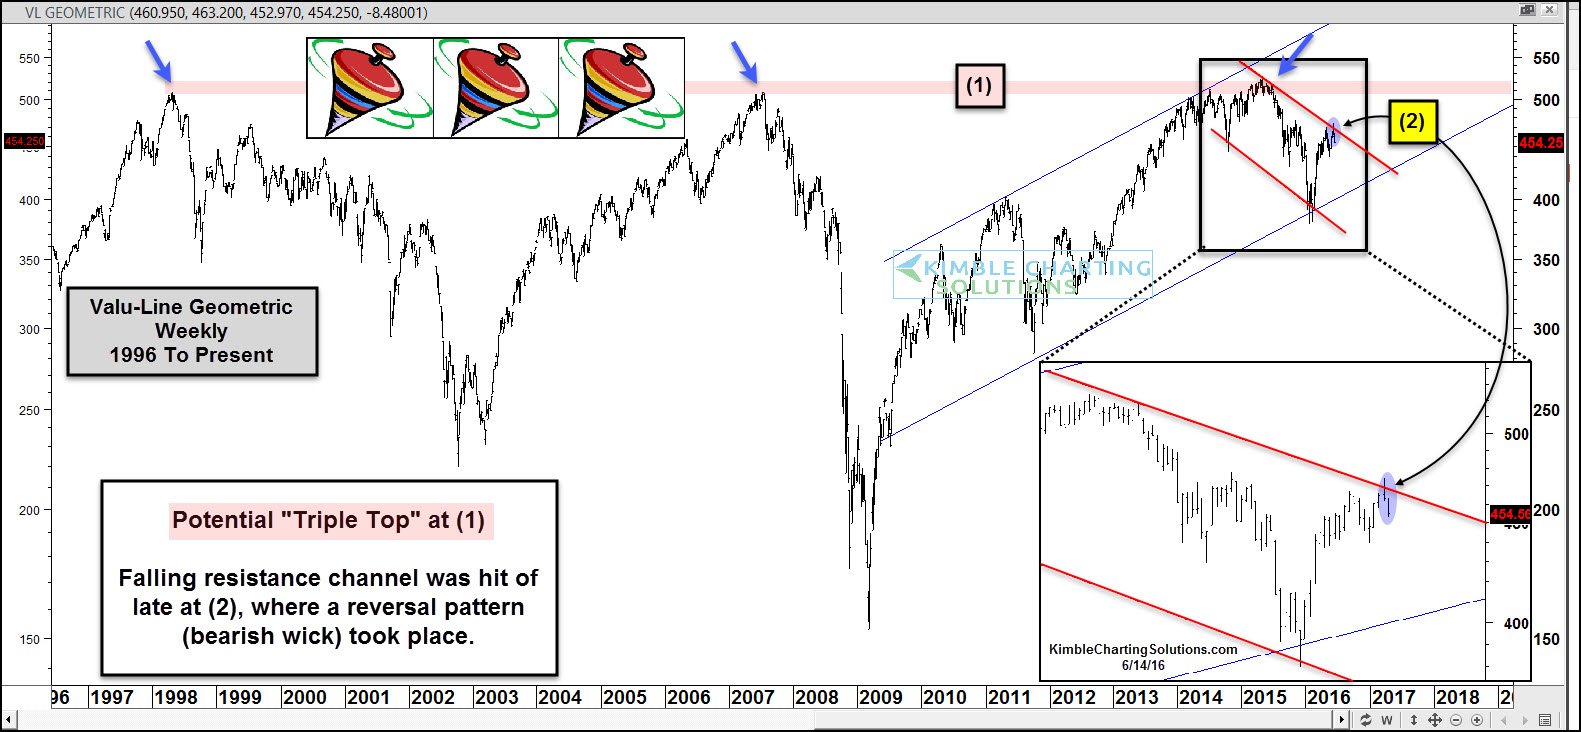
The chart above looks at the Value Line Geometric Index over the past 20-years.
This index potentially has created a “Triple Top” over the past 18-years at (1). In my humble opinion, what counts at this time is NOT whether this is a triple top.
What the Power of the Pattern thinks is important right now, is taking place at (2). Since last year, the trend in this index is down, creating a series of lower highs and lower lows. The rally off the rising support now has the index testing falling channel resistance at (2).
If weakness starts taking place at falling resistance (2), more selling pressure could come forward, as sellers could say I don’t want more of the same.
We humbly feel this test of falling resistance could become very important for where stocks are come year end.
Full Disclosure- Premium Members are short the Nasdaq at this time.
–

I wonder why it is a surprise?
Look at monthly charts of small stocks.Geometric index reminds Russell 2000 IWN actually, since the index over emphasizes small stocks.
The real issue is with small stocks. Now, when the credit is readily available to small companies I wonder whether the trend is a precursor of the bear market?