

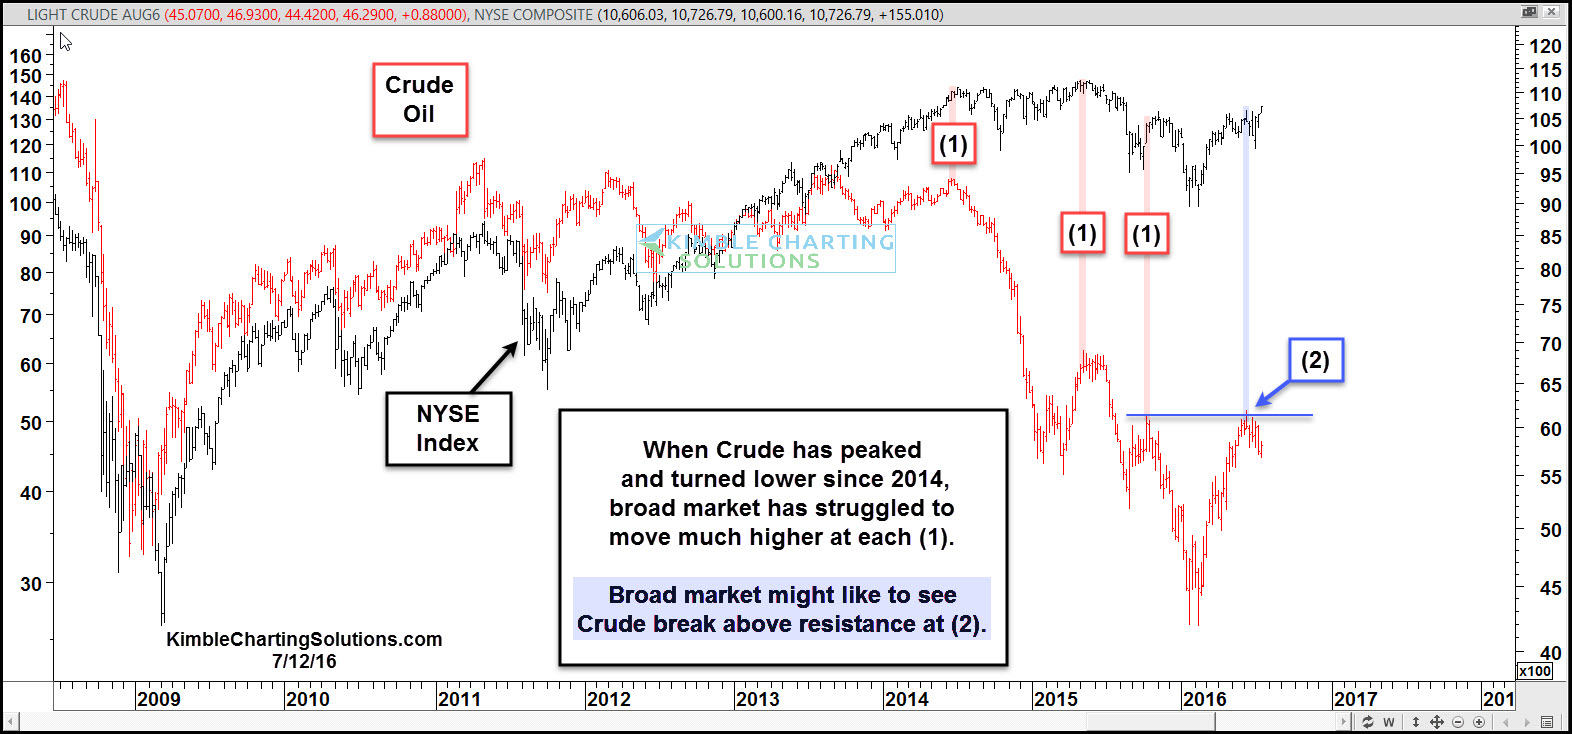
Crude Oil and the broad market has been fairly correlated over the past couple of years. The chart below looks at price patterns of Crude Oil and the NYSE Index since 2008.
One can see that both bottomed around the same time during the financial crisis and once Crude peaked in 2014, the NYSE did have much to brag about going forward, from a gain perspective.
CLICK ON CHART TO ENLARGE
When Crude Peaked at each (1) above, it wasn’t long before the NYSE index was hitting a high and turned a little softer.
A big test to the correlation is at hand right now at (2), as Crude is testing last years highs.
So goes Crude, so goes the broad markets? Will this correlation continue?
If history is any kind of a guide, the Risk On trade might want or need Crude to breakout at (2). If Crude does take last years highs, history would suggest that the broad market would like the price action.
–
