
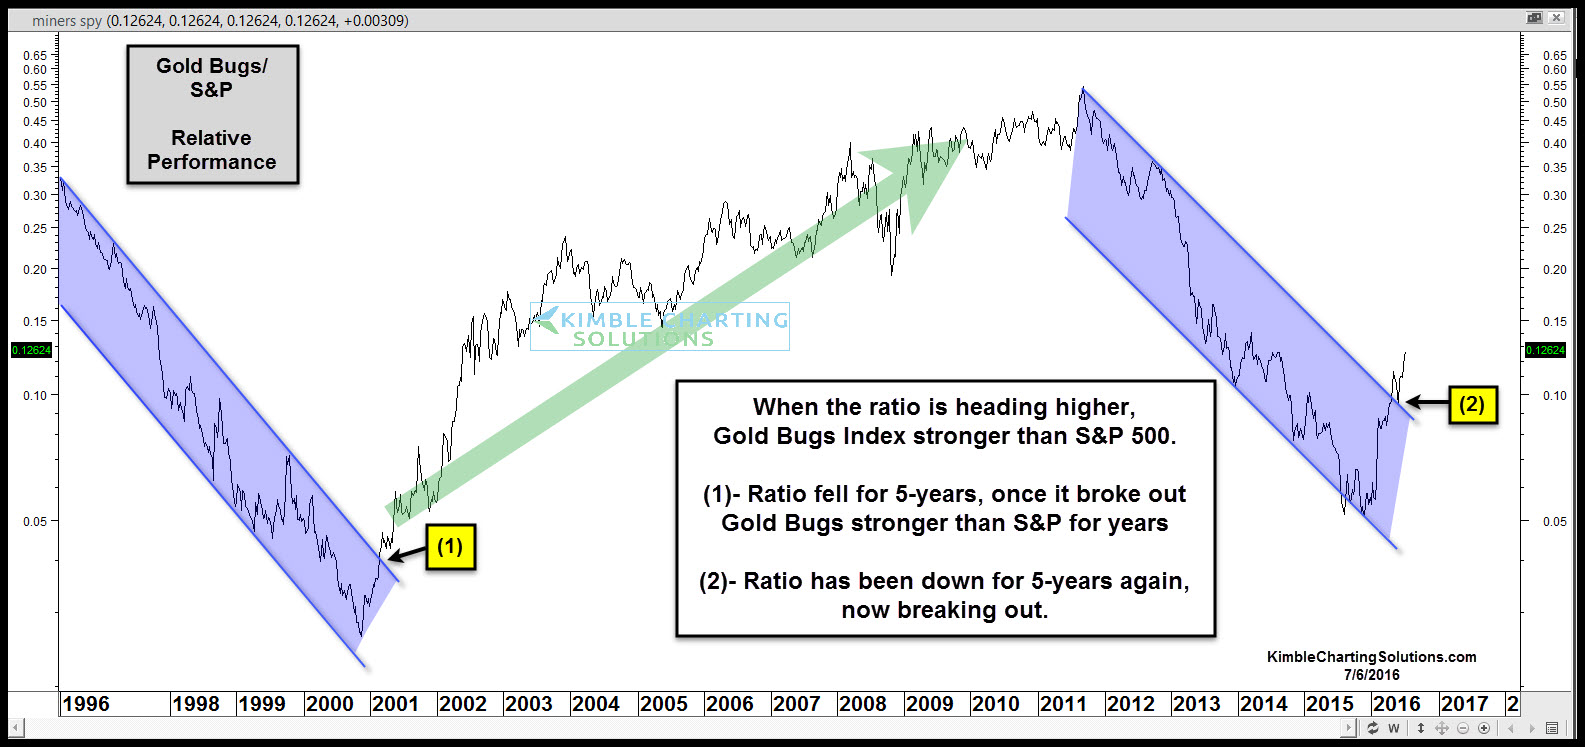
Over the past 20-years, some “solid trends” have taken place, when one compares the Gold Bugs Index (HUI) to the S&P 500. Below compares the Gold Bugs Index to the S&P 500 over the past 20-years.
CLICK ON CHART TO ENLARGE
From the mid 1990’s until 2001, the ratio above fell, reflecting that the Gold Bugs Index was “weaker” than the S&P 500. At the time the trade was to be long the S&P and short Gold Bugs. A breakout of a 5-year downtrend took place at (1) and the Gold Bugs Index (Mining Stocks) was stronger than the S&P 500 for the following decade!
Over the past 5-years, the ratio has been falling, reflecting to be short mining stocks and long the S&P 500.
The ratio is now breaking out of its 5-year downtrend at (2) above, reflecting that the Gold Bugs Index is much stronger than the S&P 500 of late.
A breakout at (1) suggested to be long miners/short S&P 500 for years (nearly a decade). A breakout at (2), favors the trade to be long miners and short the S&P 500. Will it be different this time?
If you would like to stay abreast of these patterns, we would be honored if you were a Premium or Metals Member. These members are updated on patterns like these at least weekly.
–
