

Junk Bonds have been quality leading indicator for the Risk On/Risk Off trade since the late 1990’s. I love the messages coming from junk bonds, over the past 20-years.
Junk Bond ETF’s started turning soft in 2014 and the broad markets in the states make little upward progress after that.
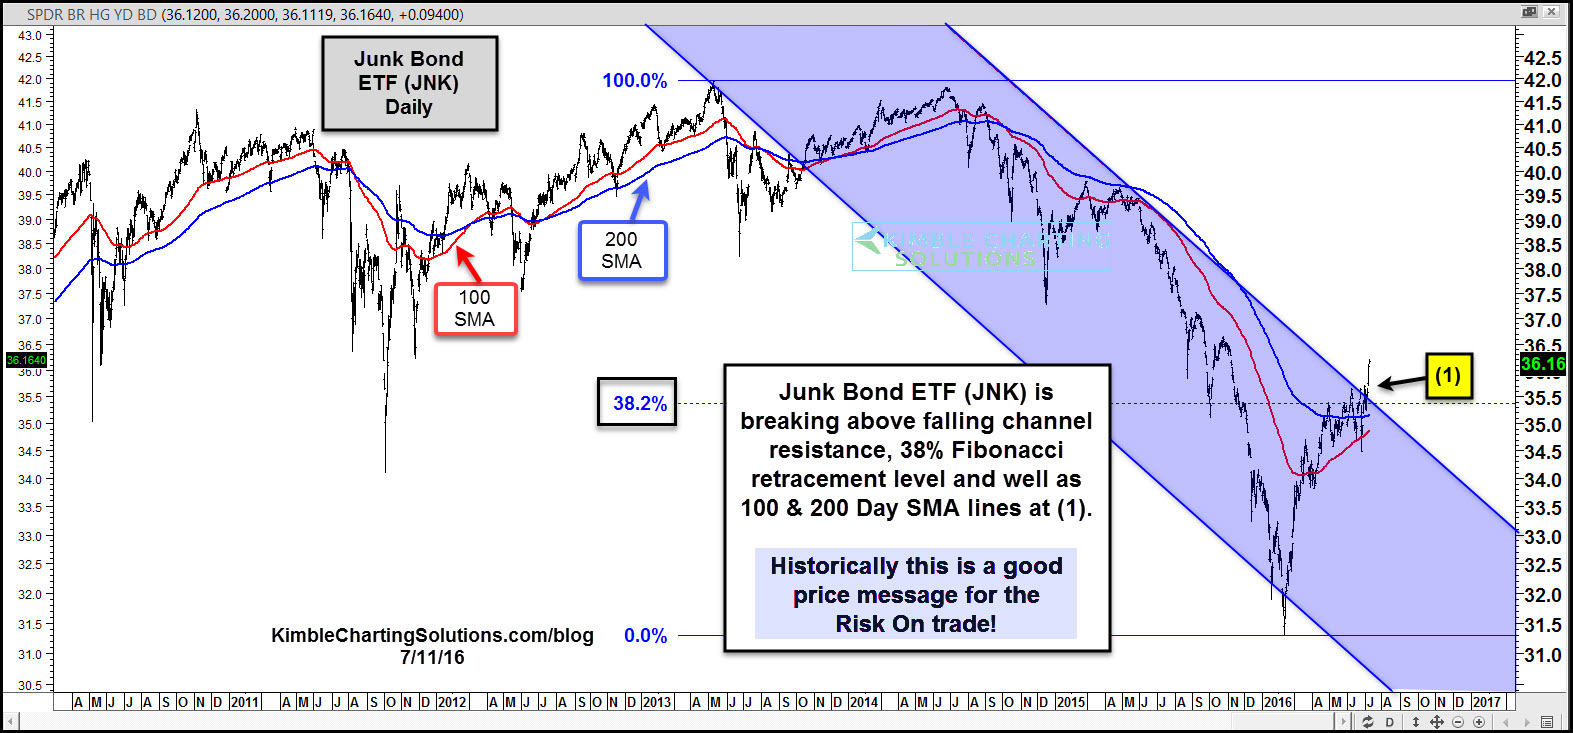
Below looks at an update on Junk Bond ETF (JNK).
CLICK ON CHART TO ENLARGE
JNK in the chart above, is breaking above its two year falling channel and is now above both the 100 and 200 day moving average lines at (1). This is the first time in over 2-years, that JNK is above its 100 and 200 day moving average lines.
With the S&P working on hitting all-time highs, this push above resistance and long-term moving averages, sends an encouraging message to the risk on trade.
–

Your information says you can idenify key market turning points, Tell me if S&P will hold support at 2146 or go up and create a double bottom or just go up to resistance. Thanks
OK we have extreams! Which way we going?
You can’t use traditional technical analysis with junk bond ETFs ala JNK or HYG. In reality, junk bonds hit all time highs on 6/8/16 and then again on 6/23 right before BREXIT. Previous all time high was 5/31/15. They are on a roll now hitting all time highs 6 of the past 7 trading days. Looking at a chart of JNK or HYG is simply not reality.
Quote