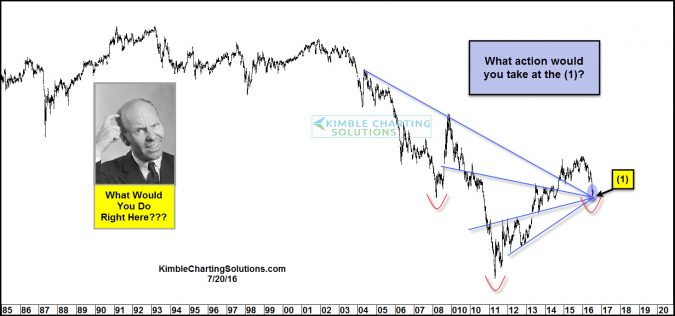
The chart looks at an assets price pattern over the past 30-years.
A potential inflection point is in play at (1) above. In my humble opinion the odds are low this is a head & shoulders pattern.
This assets is testing a cluster of support at (1) at this time.
What would you do at (1)???
If you would like to share what you would do here, we would love to hear from you. Shoot us an email at [email protected] and let us know what you would do with this pattern. If you would like to know what the asset is, send us and email and we will get you the answer a couple of days from now. Members will be updated ASAP on this pattern/potential inflection point, where a big move could take place.
–


Key inflection point and opportunity? 7/20/2016 at 6:58 am
a BUY, positive!
inflection point?
would like to know the asset
regards
This appears to be an inverse head and shoulders for gold and it looks like a possible short term fall in the gold price
I’d buy a Put spread and a Call spread and play both directions.
It may seem sacrilegious to a pure technical trader but I’d look to the fundamentals of the ‘asset’ for some insight into the current price drivers.
I would wait until I get a firm understanding of where we are ….waterfall moment or head and shoulders… the ride the wave.
Best,
Marjory
I would buy a put and a call
What is the asset in the chart?
Thanks
Hello, I would suggest the price action next will be “up”with a first price target of the 08/10 peak to the left..That peak seems to be a support/resistance level with a line drawn from the 87/98/04/05 lows.However, being a yearly chart my worry would be the risk.Where will I be proven wrong seems a long way from my entry here.I would want to find an entry on a much lower time frame chart, probably a daily one. RH
I see support down below at about the same level that was reached in year 2013.
So it is an ooportunity to go short.
I would buy, quaking to be sure.
sell short
Nothing. Wait to see a break or breakout then go short or long depending on what occurs and initially with a 5% stop to accommodate a retest of point 1.
Calls, it is about to go up, unless of course you have presented an inverse chart of whatever
in which case puts would be in order.
Please tell me what asset this is. To answer the question what would I do(?). Should the asset break through the inflection at [1], I would short it; should the asset bounce at [1], I’d buy the asset.
Good Morning,
Looks like a good buy, please share what the asset is.
Thanks
Lower highs, lower lows, this equity is weak from false breakouts and is going down, unless of course it doesn’t.
Inverse H & S, it will rise from here.
I would go short with a stop loss. Looks like the rebound above the down trend line was not too strong. Fundamentally higher asset prices do not look supported. The only thing would be what Gundlach has called a mass psychosis for yield. Therefore the stop loss. But in any case such a situation would be a short term aberration.