

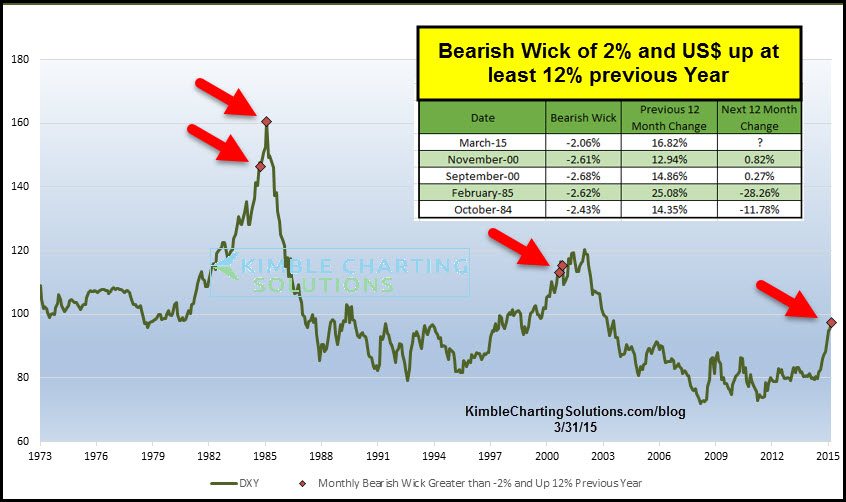
Below looks at two long-term charts of the US Dollar. Could King Dollar be creating a topping pattern?
We shared in March of last year the chart below. This chart highlighted that in the past, when the US Dollar has been very strong (up 12% or more in 12 months), it often cooled off at the least. Many times it was closer to a high than a low. See original post HERE
CLICK ON CHART TO ENLARGE
18-Months ago we shared that after the US Dollar has rallied strongly in the prior twelve months, it usually backed off. At the time of the post last year, King Dollar was screaming higher, trading near the 100 level. 18-months later, what has King Dollar done? Not much of anything!
Below looks at an update on the US Dollar, on a monthly basis-

CLICK ON CHART TO ENLARGE
As mentioned in the chart above, the US$ could be creating a head & shoulders topping pattern. Let me be clear, this pattern right now has not been proven. Potential is there, jury is still out for sure.
To tell if the pattern read is correct, the US$ needs to break below the neckline at (2). If it would, several commodities could do well.
Keep a close eye on this pattern friends, as it has taken a little over a year to form.
–
