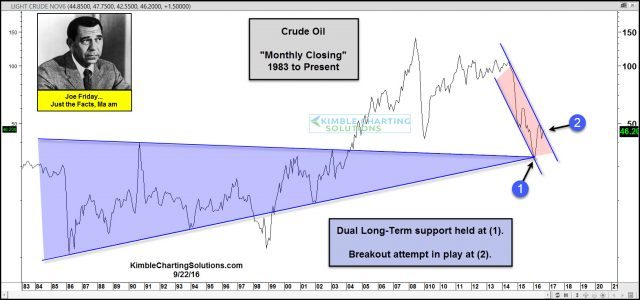
Below looks at Crude Oil on a “Monthly Closing” basis, since the early 1980’s.
Crude Oil started tanking in 2014 and its low earlier this year, took place at dual long-term support at (1) below.
CLICK ON CHART TO ENLARGE
Two support lines, that date back over a decade, came into play at (1) and so far have held. Crude remains in a down trend and this down trend is being tested at this time.
Joe Friday Just The Facts; Crude Oil is attempting to breakout of a two year falling trend at (2).
Crude and Stocks have a high degree of correlation the past couple of years. What Crude does at (2), could have a significant impact on stocks going forward!


