

Energy stocks have under performed the broad markets the past few years. Looking back over the past 5-years, XLE is up around 5%, lagging the S&P by nearly 75%. Is this under performance about to end? Below looks at XLE over the past year years.
CLICK ON CHART TO ENLARGE
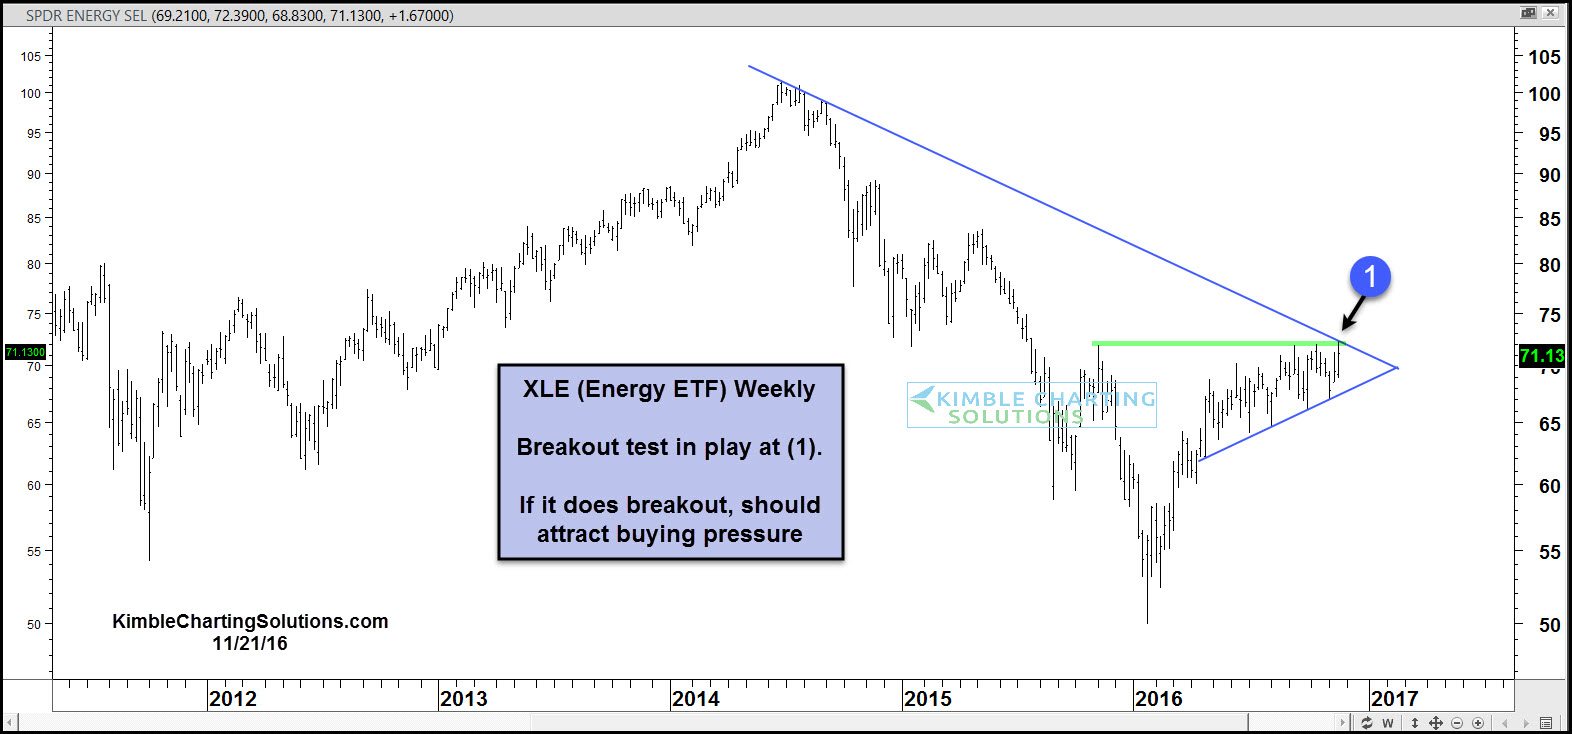
XLE looks to be testing the top of a bullish ascending triangle pattern at (1).
This lagging 5-year performer could attract a good deal of buying pressure, if it can hurdle over these breakout lines!
