

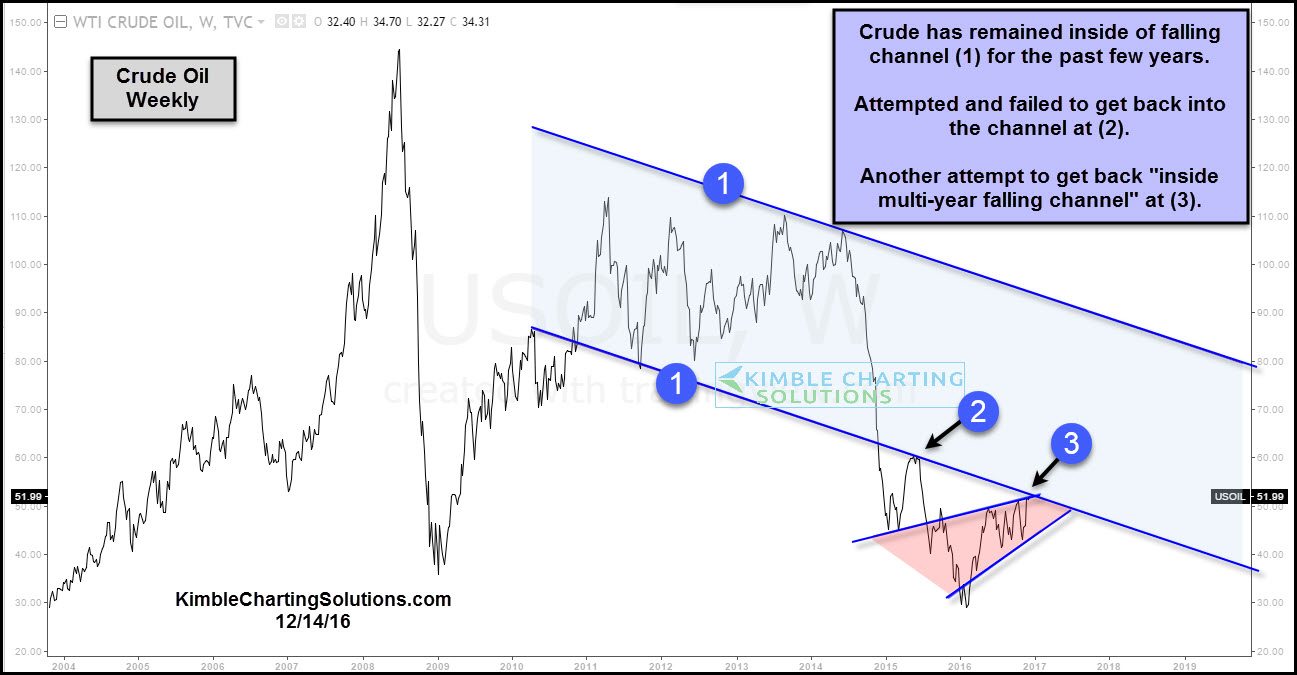
Below looks at Crude Oil over the past dozen years. Since 2011, Crude Oil has remained inside falling channel (1) for the majority of the time, until it slipped below support back in late 2014. Once it broke support in late 2014 at the $60 level, selling pressure took place.
CLICK ON CHART TO ENLARGE
After breaking support in 2014, Crude rallied to test the “underside of falling resistance” at (2), where it hit a brick wall of resistance! When it failed to climb back into falling channel (1), selling pressure took place in Crude, sending it from $60 to $30 is quick order.
Now Crude is testing the underside of falling channel resistance at (3), similar to the test that took place at (2). Does this represent another “Brick Wall Of Resistance” for Crude?
The Power of the Pattern suggests this is NOT your typical resistance test for Crude. We humbly feel what happens at (3), is very important for Crude and could be VERY important for the bond sector. Premium Members have been long the energy space for a while. We have been taking profits of late and pulling up stops, due to the brick wall test at (3).
Should a breakout at (3) take place, we will be looking to add holdings in the energy sector. If resistance holds, the hard hit bond market has a chance to provide some out of favor opportunities!
