
Some tools are used to measure inflation or lack of. Some look at the price of Crude Oil, Doc Copper or the Commodities Index (CRB) to determine if inflation or deflation is in play. Since 2011, most commodities have created a series of lower highs and lower lows and for many, it has been easier to make the case of deflation than inflation, is in play.
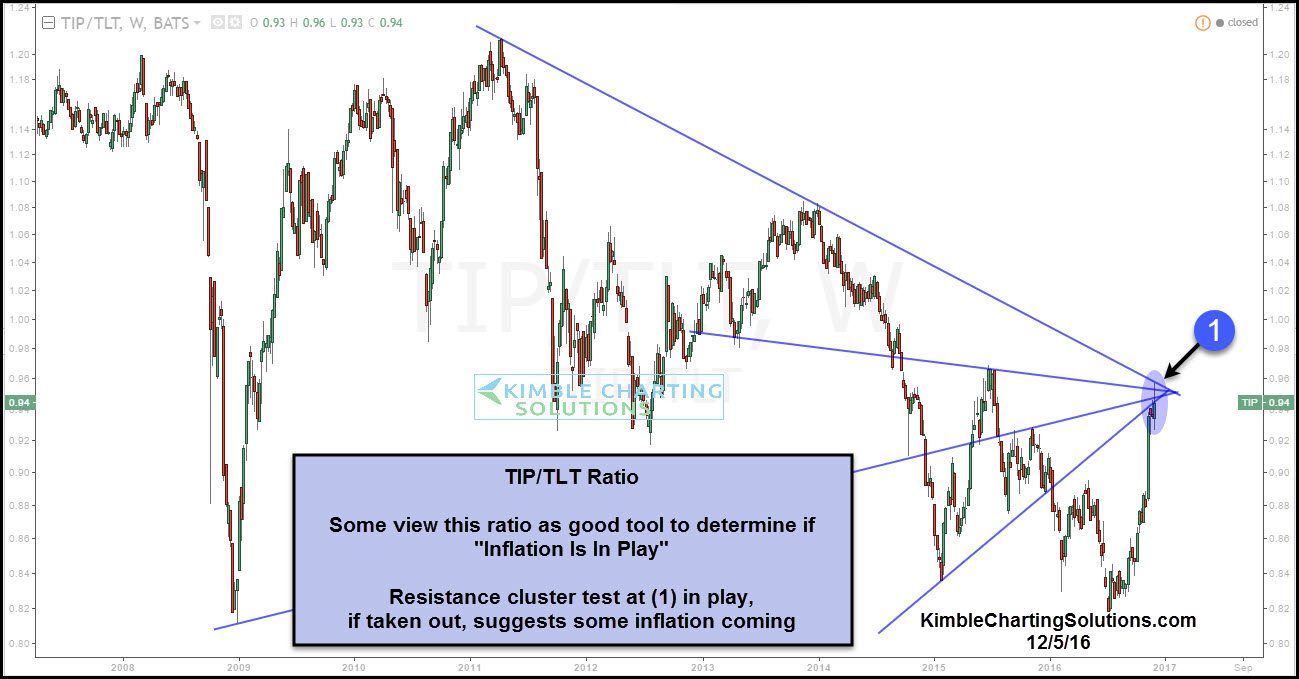
Below looks at another tool, that is often used to determine if inflation or deflation is in play. This tool we are referring too is the TIPS/TLT ratio-
CLICK ON CHART TO ENLARGE
Since 2011, the TIP/TLT ratio has continue to create a series of lower highs and lower lows. The ratio in July of 2016, hit the same level as the lows, during the 2009 financial crisis. Double bottom?
Since July the TIP/TLT ratio has moved sharply higher. This 4-month rally has not taken the ratio up to test a cluster of resistance at (1).
The Power of the Pattern humbly feels, what takes place at (1), breakout or resistance holds, will tell us a ton about inflation going forward, which will have a large impact on portfolio construction in the near future.
