

Interest rates have shot up since this past July. Have they “stretched too far too fast?”
One way to measure if an asset has made a rare/extreme short-term move, is too see how far above or below its 200 day moving average, it is.
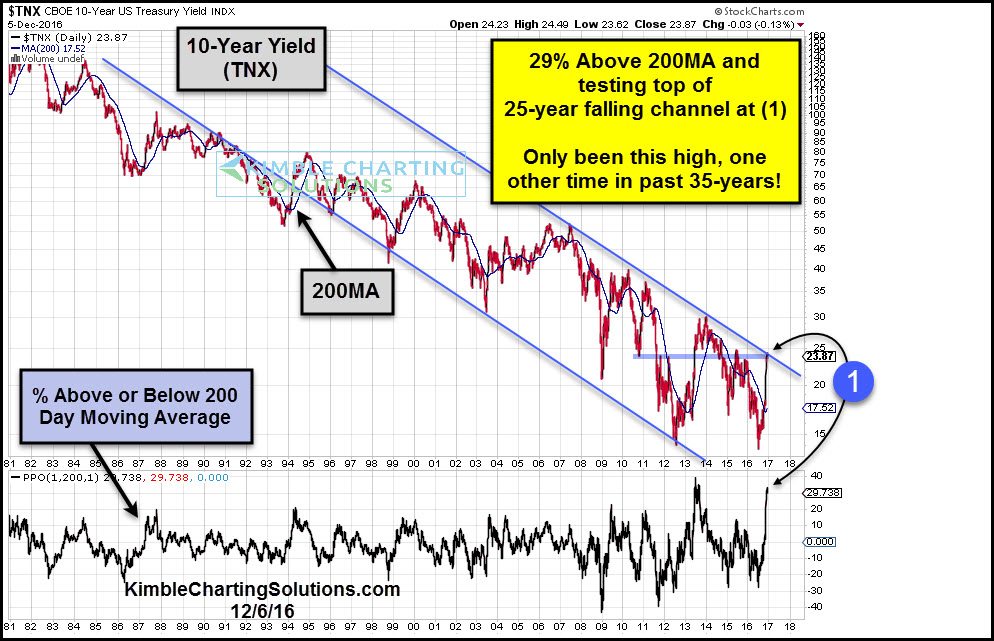
Below looks at the yield on the 10-year note, going back to the early 1980’s.
CLICK ON CHART TO ENLARGE
The sharp rally in yields over the past 5 months, has the yield on the 10-year note now 29% above its 200MA line at (1) above. Only one other time in the past 35-years, has yields been this far above its long-term moving average.
At the same time yields are way above the 200MA line, they are also testing the top of a 25-year falling yield channel as well.
Did rates get stretched to the upside, too much of late? Long-term falling trend in rates is being tested right now and the results could be very important from a macro point of view and portfolio construction!
