

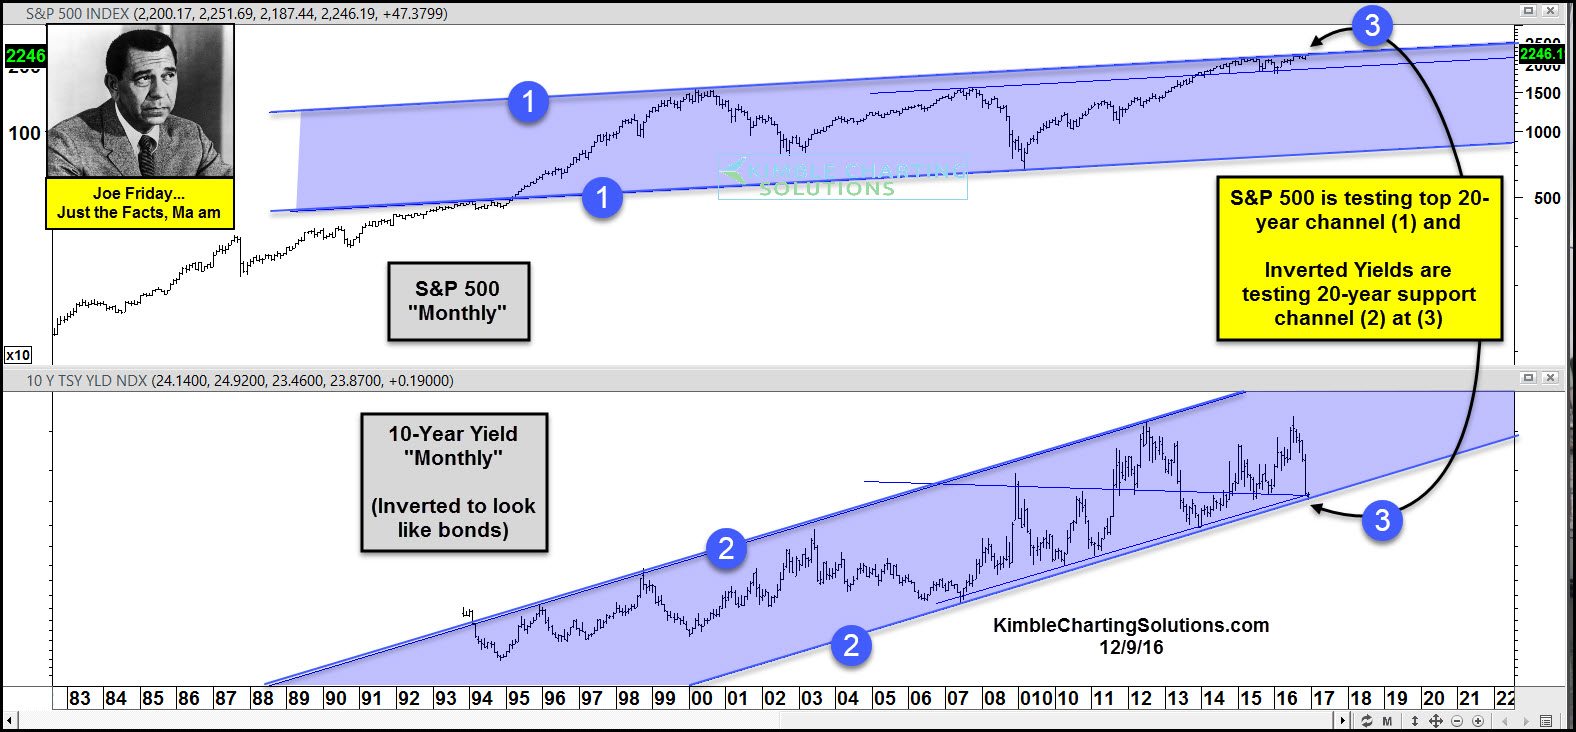
Below looks at the patterns on the S&P 500 and the Yield on the 10-year note (Inverted to look like bond prices), since the late 1980’s. A rare test of support and resistance by stocks and bonds, is in play right now!
CLICK ON CHART TO ENLARGE
The S&P 500, has remained inside of rising channel (1), for the majority of the past 20-years.
The 10-year yield (Inverted) has remained inside of rising channel (2), for the majority of the past 20-years.
S&P is being presented with a chance to breakout of its 20-year channel and yields are being presented with a chance to break down out of a 20-year rising channel at (3).
Just The Facts…. Seldom has stocks been hitting resistance and inverted yields at support, at the same time. One of them was back in 2007! What takes place at (3) is NOT your average test of support & resistance friends!!!
All of this is taking place, as sentiment is also reflecting some rare numbers. According to Sentimentrader.com the bullish sentiment on the 30-year yield is near “0% bulls” and the dumb money stock confidence level, now stands near the “80% bullish level.”
Will it be different this time friends??? It will be different and again, markets are presenting a beautiful Power of the Pattern Opportunity to make nice gains!!! Come along for the ride with us, would be honored if you were a Premium Member.
