

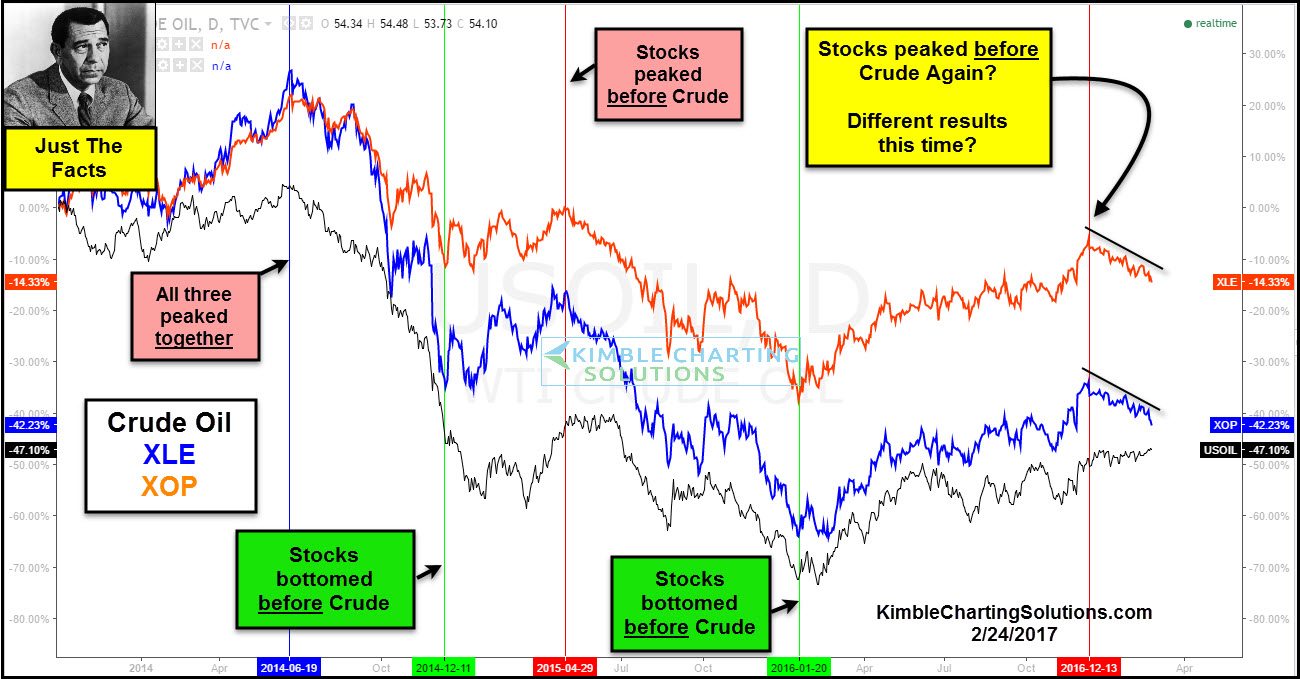
Below takes a look at the price action of Crude Oil, Energy ETF (XLE) and Oil & Gas Exploration ETF (XOP) over the past three years.
Could Energy stocks be suggesting the next big move in Crude Oil again? Which direction are they suggesting?
CLICK ON CHART TO ENLARGE
At this time the intermediate trend in Crude Oil is up, as it has rallied the past year, creating a series of higher lows and higher highs. Since the highs in 2014, Crude remains at much lower levels.
Joe Friday Just The Facts; Majority of the time since 2014, XLE & XOP have peaked or bottomed “before” Crude Oil! Of late XLE and XOP have negatively diverged against Crude Oil, creating a series of lower highs.
Crude could be forming a bullish inverse head & shoulders pattern. Maybe that is the reason that Crude Oil traders, have established the largest bullish trade in it’s history. Last time the bullish bet on Crude Oil was this high, was at the highs back in 2014.
Are XLE & XOP giving false signals this time? Will results be different this time. I humbly feel Crude Oil could be one of the most if not THE most important commodity in the world. Which direction Crude takes from its narrow/sideways pattern of late, will have a large impact on portfolio construction in numerous sector.
