

Retail stocks don’t have much to brag about over the past couple of years. Is this trend about to change, at least for Wal-Mart (WMT)?
Below looks at a chart of WMT over the past decade. As you can see, since the highs in early 2015, WMT has created a series of lower highs.
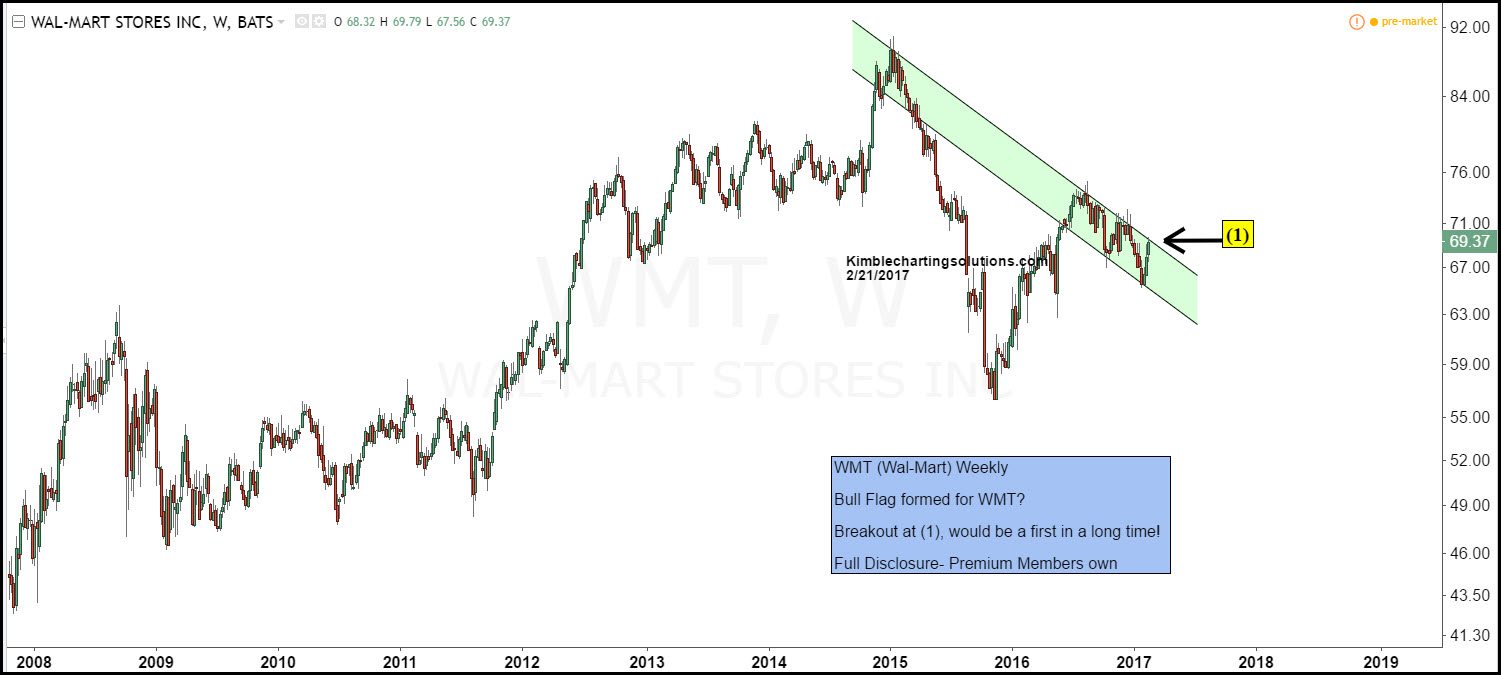
CLICK ON CHART TO ENLARGE
WMT has struggled to make upside headway inside of the falling channel highlighted above. Potential that WMT has created a “bull flag” pattern with a breakout test in play at (1).
If WMT does take out resistance, it could attract buyers to the stock and Retail ETF (XRT)
Full Disclosure- Premium Members are long WMT with a tight stop.
