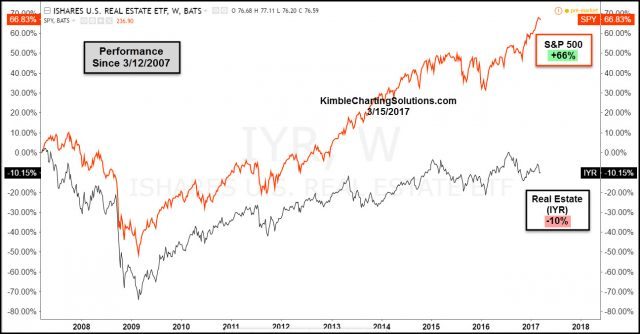
Below compares the performance of the S&P 500 and Real Estate ETF (IYR) over the past 10-years. Since the highs in 2007, IYR has little to brag about as it’s net asset value has declined 10%. The S&P during this same time frame is up 66%.
CLICK ON CHART TO ENLARGE
Below compares the relative performance of Real Estate to the S&P since 2001-
CLICK ON CHART TO ENLARGE
This chart reflects how Real Estate ETF (IYR), continues to be much weaker than the broad market over the past 10-years, This under performance now has the the ratio, testing 2009 financial crisis lows.
Many are of the opinion that IYR benefits from falling rates and is challenged when rates head higher. If the FED is to raise rates today or in the near future, would that put downside pressure on IYR? With this ratio now testing an extreme (financial crisis lows) could this be an opportunity in play at (2) above?
CLICK ON CHART TO ENLARGE
What the ratio does int the top chart at 2 (testing financial crisis lows) and what the DJ Home Construction index does at (1), could tells us a good deal if the “reflation trade” is peaking or about to really pick up speed to the upside.
Humbly find it very interesting to see two different real estate plays at support/breakout tests at the same time, the FED is looking at raising rates today.


