

The US Dollar has been a stellar performer the past few years, as it has been stronger than most currencies around the world. The chart below looks at US$ over the past couple of years and highlights that it could be creating some patterns, that are often associated with price points were selling pressure gets started.

CLICK ON CHART TO ENLARGE
Back to back to back weeks (three weeks in a row) the US$ looks to have created reversal patterns (bearish wicks) at (1), at the top of a short term falling channel. Since creating these reversal patterns, US$ has been weak and could be breaking below the key 100 level.
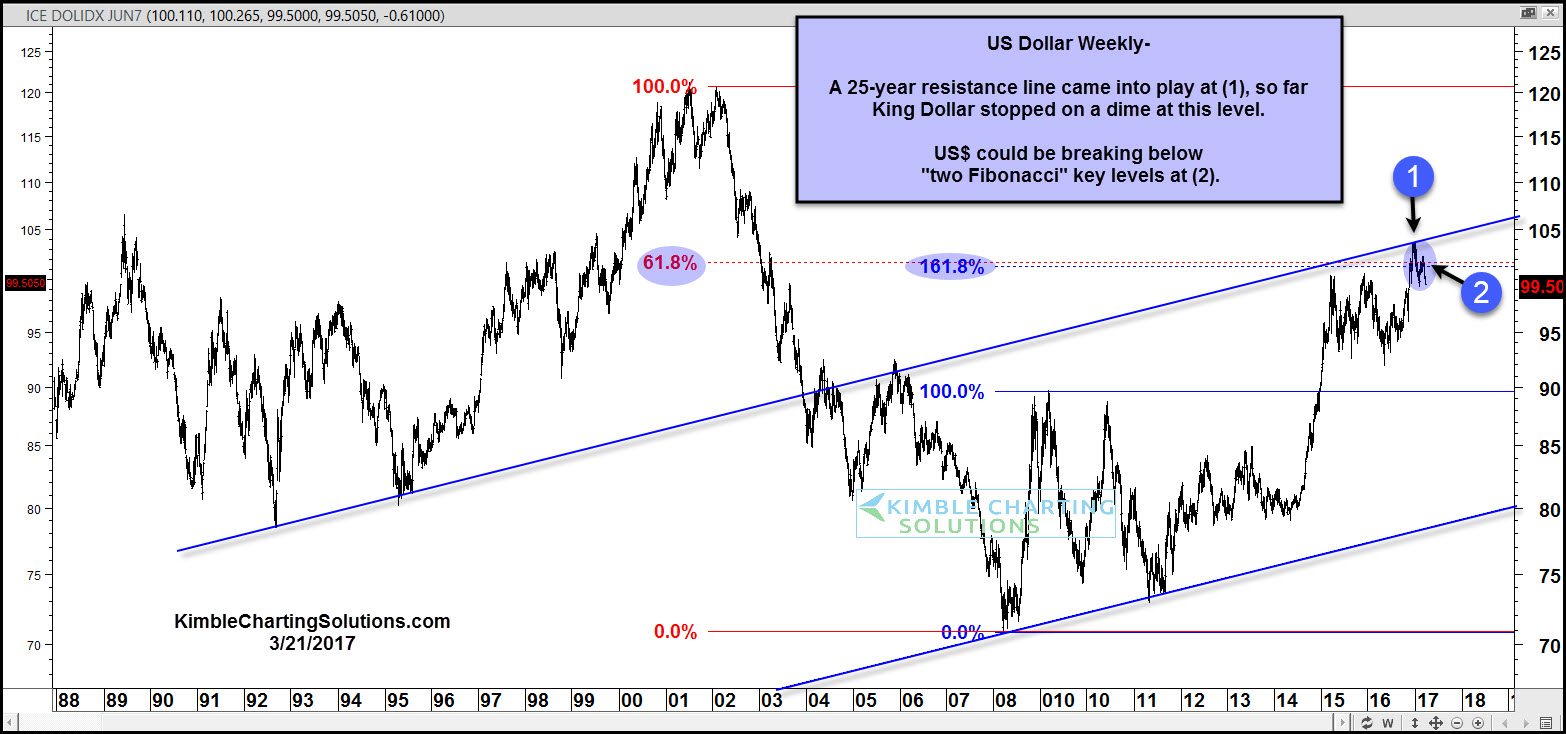
The chart below looks at the US$ over the past 25-years and reflects that it hit a 25-year resistance line and stopped on a dime
CLICK ON CHART TO ENLARGE
Weakness at (2) could cause US$ selling. Humbly feel what the US$ does at (2), will send many great clues for what assets to overweight towards and what to underweight, going forward.
