

Below compares the price of Crude Oil and the NYSE Index over the past decade. Even though both of these assets don’t always correlate, sometimes they do, for good periods of time. Over the past couple of years, they have correlated and several lows and highs have taken place at the same time. If correlations are to continue, what Crude does next, could be very important for the bull market in stocks.

CLICK ON CHART TO ENLARGE
Crude Oil hit falling resistance at (1), which appears to be the top of a narrowing pennant pattern. Once it hit resistance at (1) a couple of weeks ago, Crude has turned rather soft. The decline now has it testing rising support at (2), which appears to be support of the narrowing pennant pattern. If correlations are to remain high between the two, what Crude does at (2), could become very important for the broad markets.
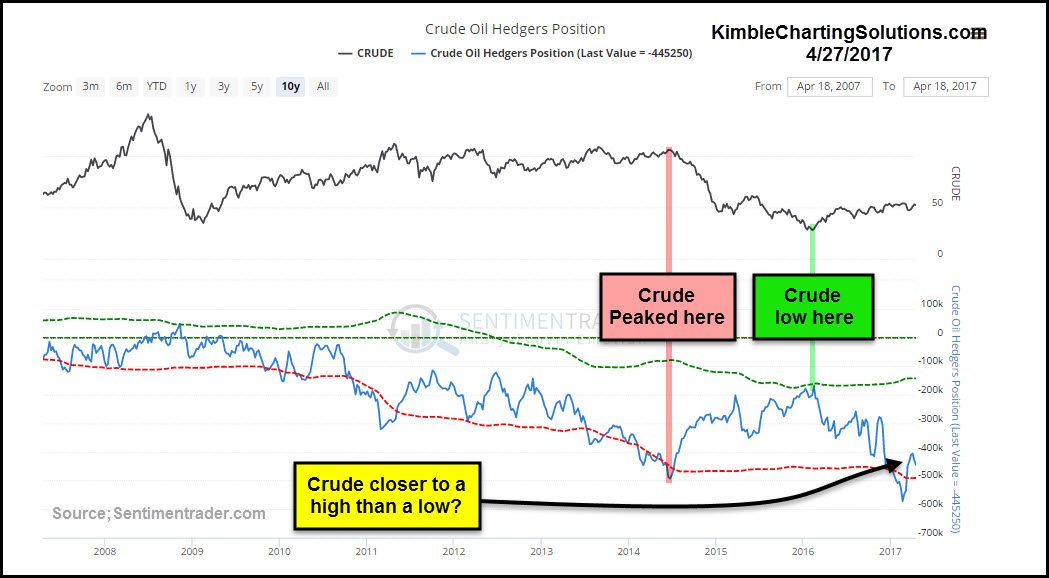
Below looks at positions by traders from Sentimentrader.com.
CLICK ON CHART TO ENLARGE
If traders and positions is any indicator of the future prices of Crude oil, history would suggest that Crude is closer to a high than a low, due to the chart above.
Bottom line with these two charts, Crude and the NYSE remain highly correlated over the past couple of years and Crude Oil is testing rising support. If Crude would happen to break below support and correlations remain high, a break could cause some selling pressure in stocks.
