

Most are familiar with the idea of “Sell in May and go away.” Should one take this advice and sell a month earlier this year?
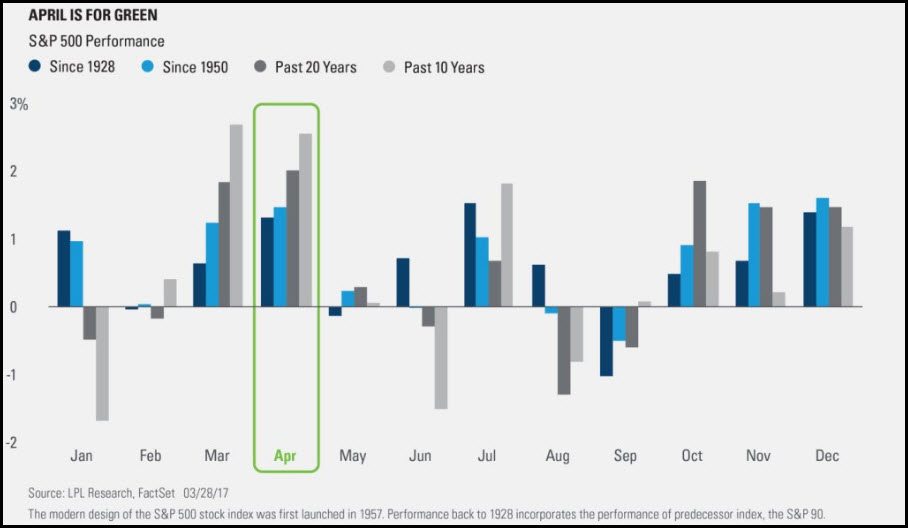
The chart below is from good friend Ryan Detrick, looking at monthly returns of the S&P 500’s performance, over four different time frames.
CLICK ON CHART TO ENLARGE
The above chart reflects a couple of things; April has historically been a month that it has paid to be long stocks. The window from May through October has been softer, than the other 6-months of the year.
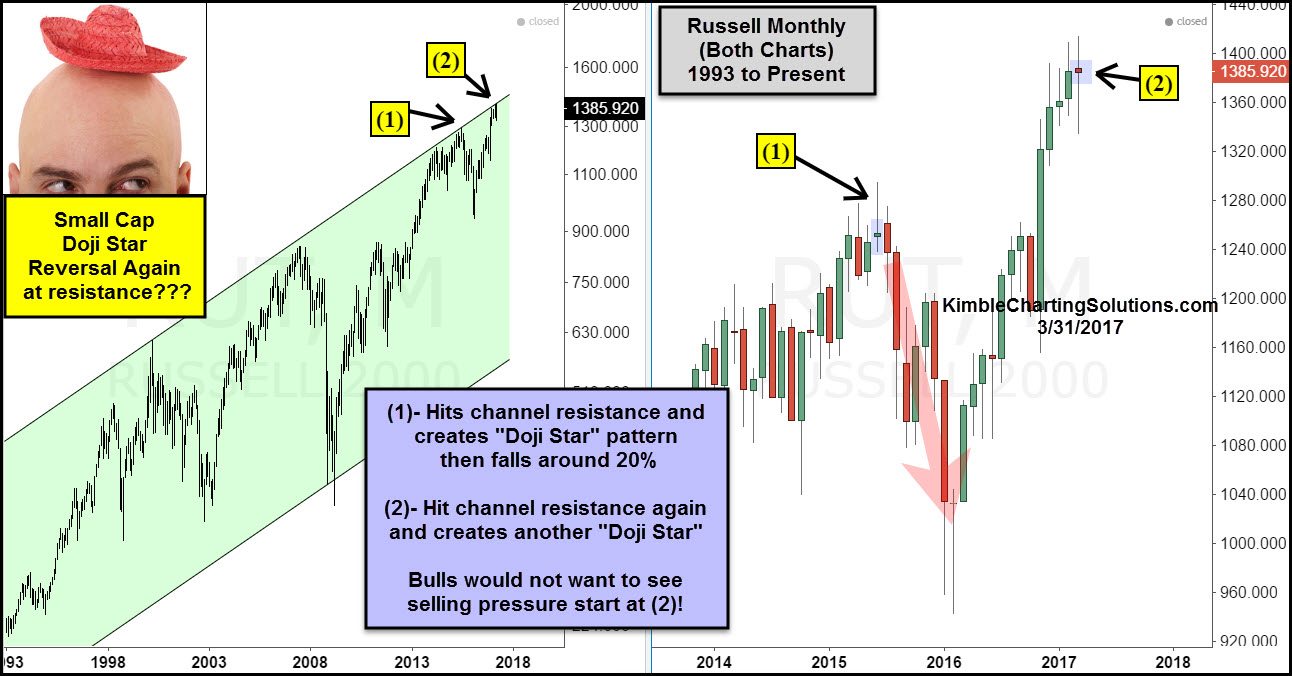
The two charts below of the Russell 2000 index might be very important to keep an eye on. Both are monthly charts, with the left chart looking at patterns since the early 1990’s and the right chart just the past few years.
CLICK ON CHART TO ENLARGE
The left chart above highlights that the Russell 2000 has remained inside of a rising channel for the past 20-years. On 6/1/15 at (1), the Russell index created a “Doji Star” pattern a the top of the rising channel at (1). In 2015, the “Sell in May” was spot on for the Russell 2000 index, as it peaked in June and then proceed to decline nearly 20% going into the fall of 2015.
This year, Small Caps are testing the top of this long term channel and could have created a “Doji Star” pattern at resistance, last month. With this being a monthly chart, it could take a while on the calendar to see if this monthly pattern will be an influence on this important index. Should the Russell breakout in the historically strong month of April, the Doji Star would end up being nothing more than noise.
A month from now if the Russell would happen to be a good deal lower in price, this past months pattern, could be an important price point for small caps. We will revisit this chart next month and the month after, to see if this pattern was an influence on small caps.
