

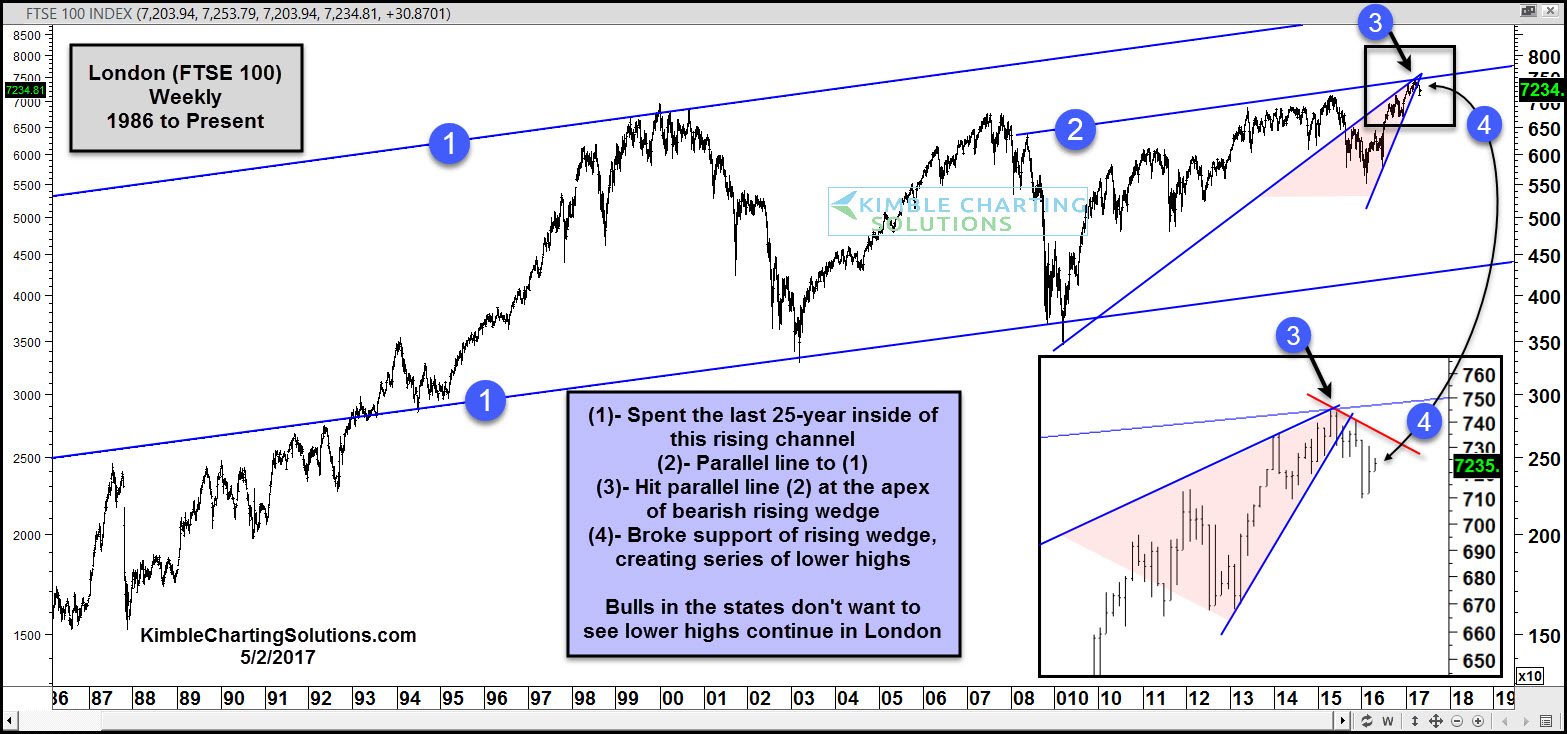
Below looks at the FTSE 100 index from London, over the past 30-years. The long-term trend in this important index from Europe remains up, as it has created a series of highs lower and higher highs, since the 2009 lows. The FTSE has spent the majority of the past 25-years, inside of rising channel (1).
CLICK ON CHART TO ENLARGE
Line (2) is a parallel line of (1). This line was placed on the 2008 counter trend highs, creating another lower parallel rising channel. Line (2) was hit as resistance on the first week of spring (3/17/17) at the apex of a bearish rising wedge at (3). Since then, the index has created a series of lower highs over the past 6-weeks and has broke below support of the rising wedge pattern at (4). The index is down around 3% since hitting dual resistance at (3), nothing big at this time.
Bulls in the states want to see this important index from Europe, heading higher, not reflecting weakness. With the trend in the index still being up, bulls should’t be too alarmed at this time.
What level should the bulls be concerned? If the FTSE would happen to break below 2000 highs at the 6,950 zone, then this index would send a concerning message to the states.
