

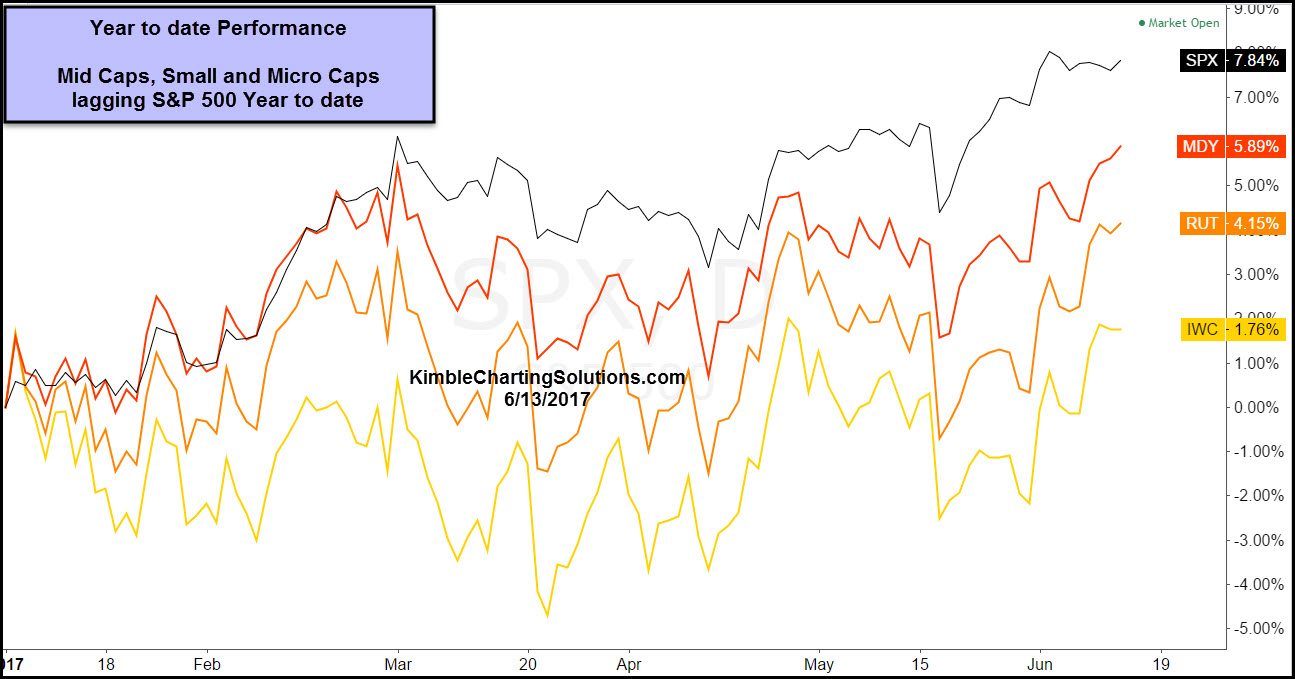
The S&P 500 has done well this year, up almost 8% as we approach the half way point of the year. Mid, Small and Micro caps can’t say the same performance wise, as each is lagging large caps so far this year. See chart below.
CLICK ON CHART TO ENLARGE
Could small caps be in a position that they might be able to play a game of catch up with large caps or actually out perform? Below looks at patterns of Small and Mid Caps.

CLICK ON CHART TO ENLARGE
Mid-Caps (MDY) and Small Caps (Russell 2000) at testing resistance of what looks to be bullish ascending triangles. This pattern two-thirds of the time results in higher prices. If they both would happen to breakout at (1), each could be attractive to buyers, which could push it higher.
With both of these lagging the broad market year to date, what each do at (1), could impact large caps. Humbly feel what these do at the top of this pattern, will become very important price action for them and large caps.
