
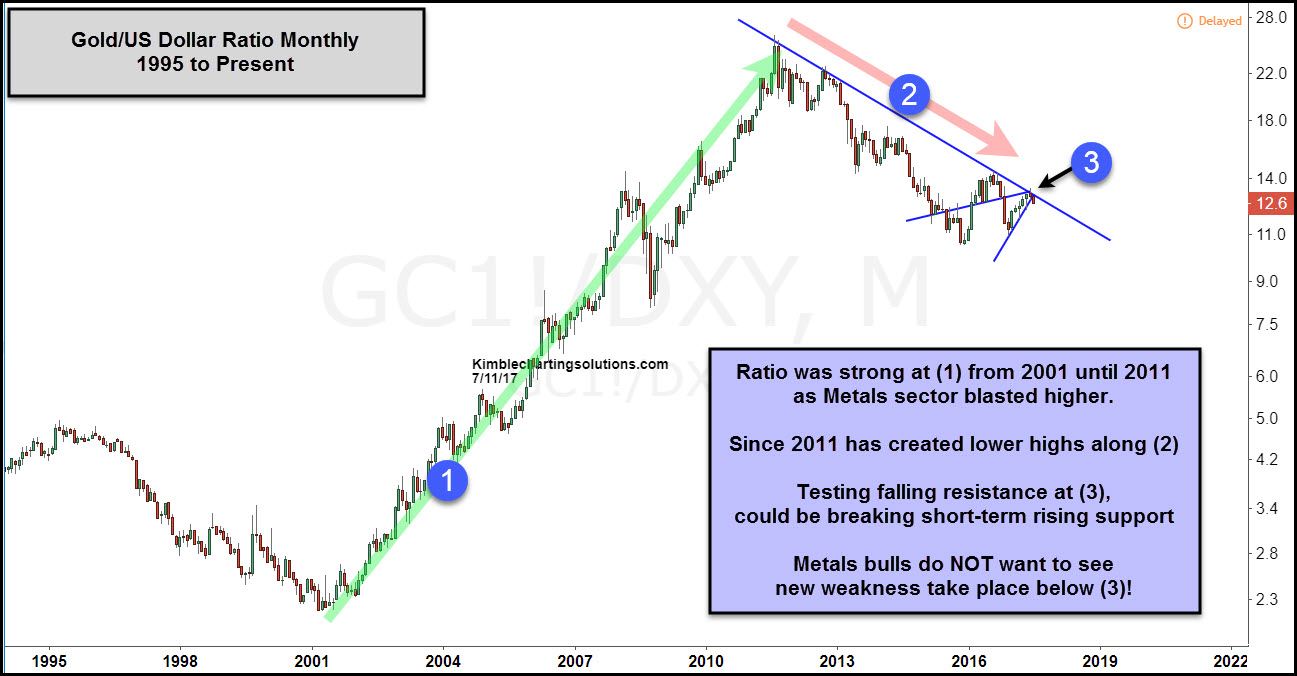
Gold for nearly a decade (2000-2011) was much stronger than the US Dollar, reflected at (1) below. Once this ratio peaked in 2011, it has created a series of lower highs along falling resistance (2) in the chart below.
CLICK ON CHART TO ENLARGE
A counter trend rally has taken place since last year, taking the ratio up to the underside of falling resistance line (2) at (3).
For Gold to break free of this 6-year falling trend it needs to breakout at (3). Gold bulls do NOT want to see this ratio peak at (3) and start turning lower!
Gold has run out of steam for the past few years along line (2), will see if its different this time around at (3).
