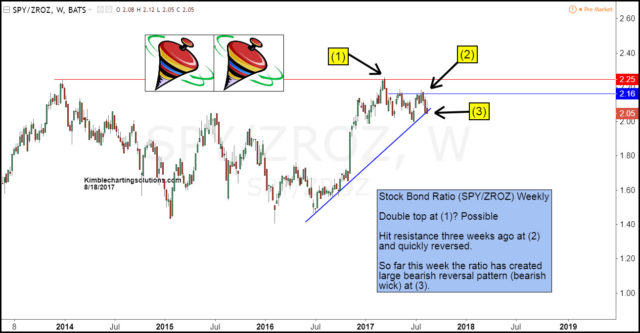
Below looks at the Stock/Bond ratio, which is created by using the S&P 500 and Zero Coupon Bond ETF (ZROZ). The chart below looks at the price action over the past three years. Since the highs back in 2014, the ratio for the most part has created a horizontal channel, chopping back and forth.
CLICK ON CHART TO ENLARGE
The ratio hit the 2014 highs earlier this year at (1), which in time could reflect that a double top took place. Right now it is way too early to confirm this. Since hitting 2014 highs at (1) the ratio has been a little soft, nothing dramatic for sure.
Three weeks ago the ratio tested lower highs again at (2), where it created a small bearish reversal pattern and then started to turn a little lower. This week the ratio so far has created a sizable bearish reversal pattern (bearish wick), reflecting weakness in stocks and strength in bonds
Joe Friday Just The Facts– Ratio is testing 1-year rising support this week and so far support is support until broken. If support would give way, could suggest further weakness in stocks and relative strength in bonds.


