

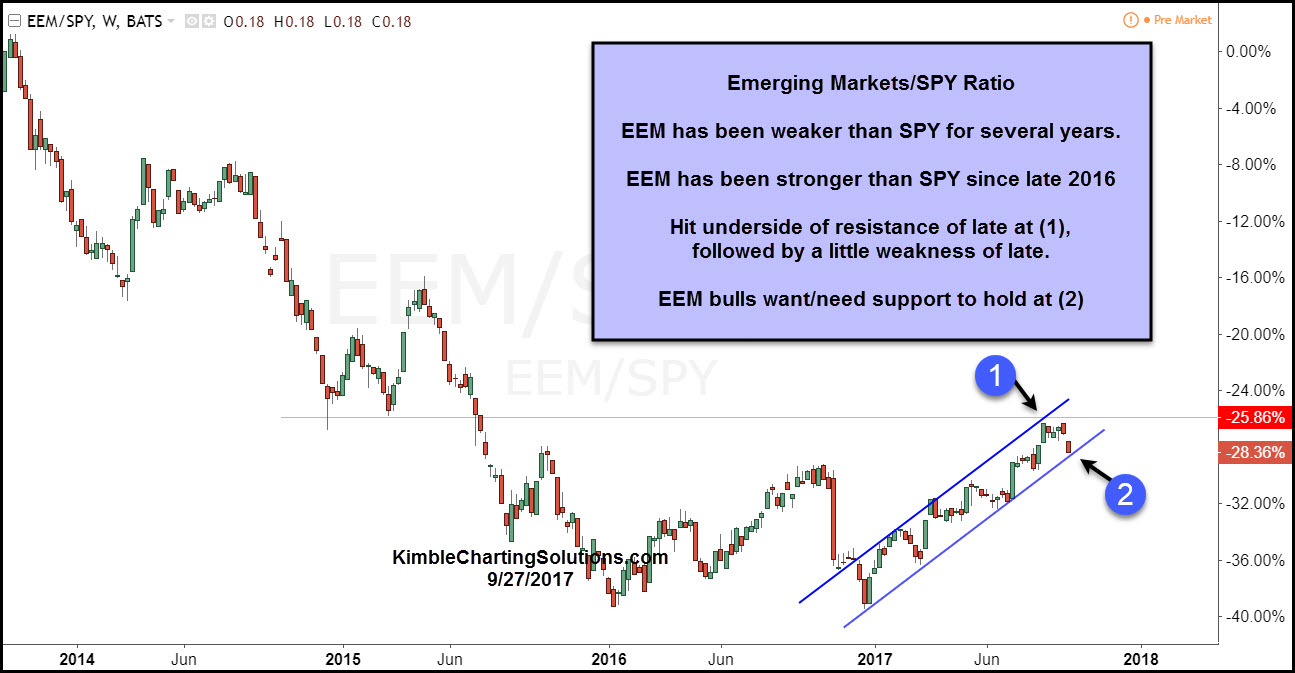
Emerging markets were much weaker than the S&P 500 from 2011 to 2016, underperforming the S&P by more than 60%. Over the past 10-months, Emerging markets (EEM) have been much stronger than the S&P 500. Below highlights the strength of EEM over SPY the past year.
 CLICK ON CHART TO ENLARGE
The ratio has created a uniform rising channel, that hit dual resistance at (1) around 6-weeks ago. Since hitting dual resistance, EEM has underperformed the S&P for the past 6-weeks, as it is now testing rising support at (2). This is a big test of support at (2), due to the 10-year trend of lower highs remains in play.
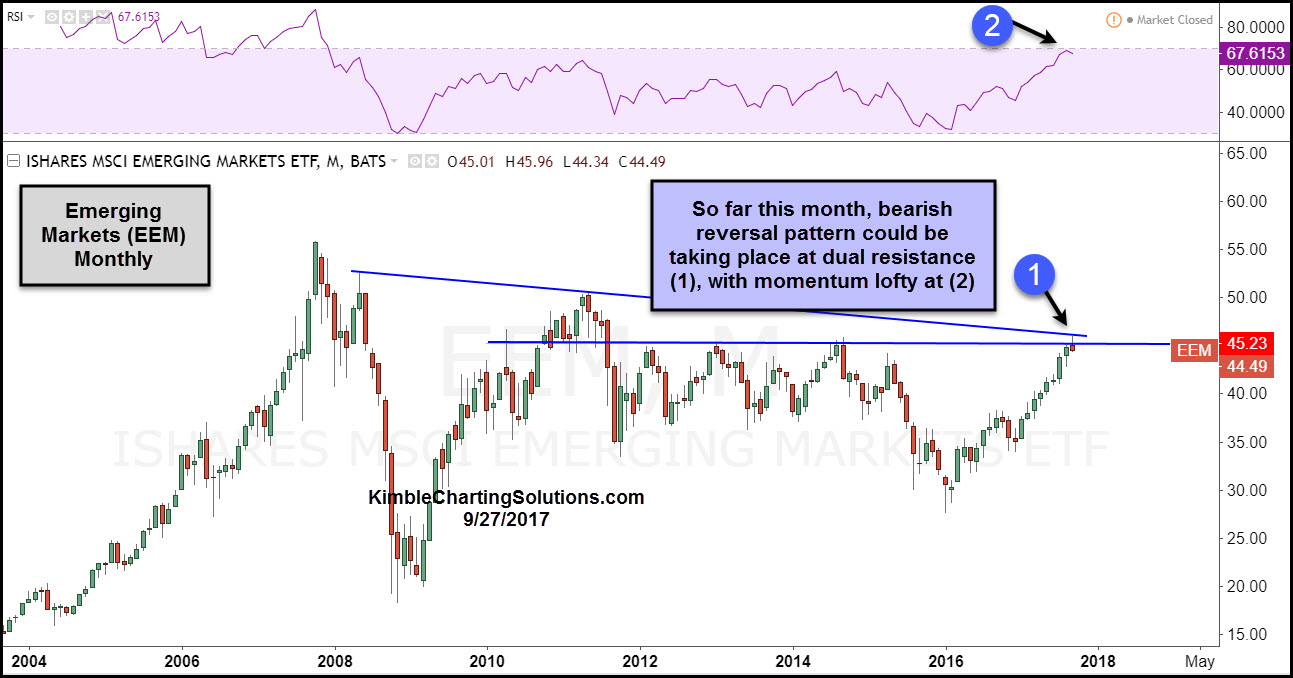
Below looks at EEM on a monthly basis over the past 13-years-
CLICK ON CHART TO ENLARGE
As the month is nearing a close, EEM could be forming a bearish reversal pattern (bearish wick) at dual resistance at (1), while momentum is the highest since the peak in 2007. If weakness would happen to start taking place at (1), would send caution message to EEM bulls. Emerging markets bulls want to see a breakout at (1), not weakness taking place!
EEM peaked in 2012, 2013 and 2014 just below the $45 zone. Bulls would get an encouraging price message if resistance is taken out. We humbly feel what takes place at this key price point at (1), is one of the most important tests in years for EEM! Might be worth keeping a very close eye on what happens here.
