

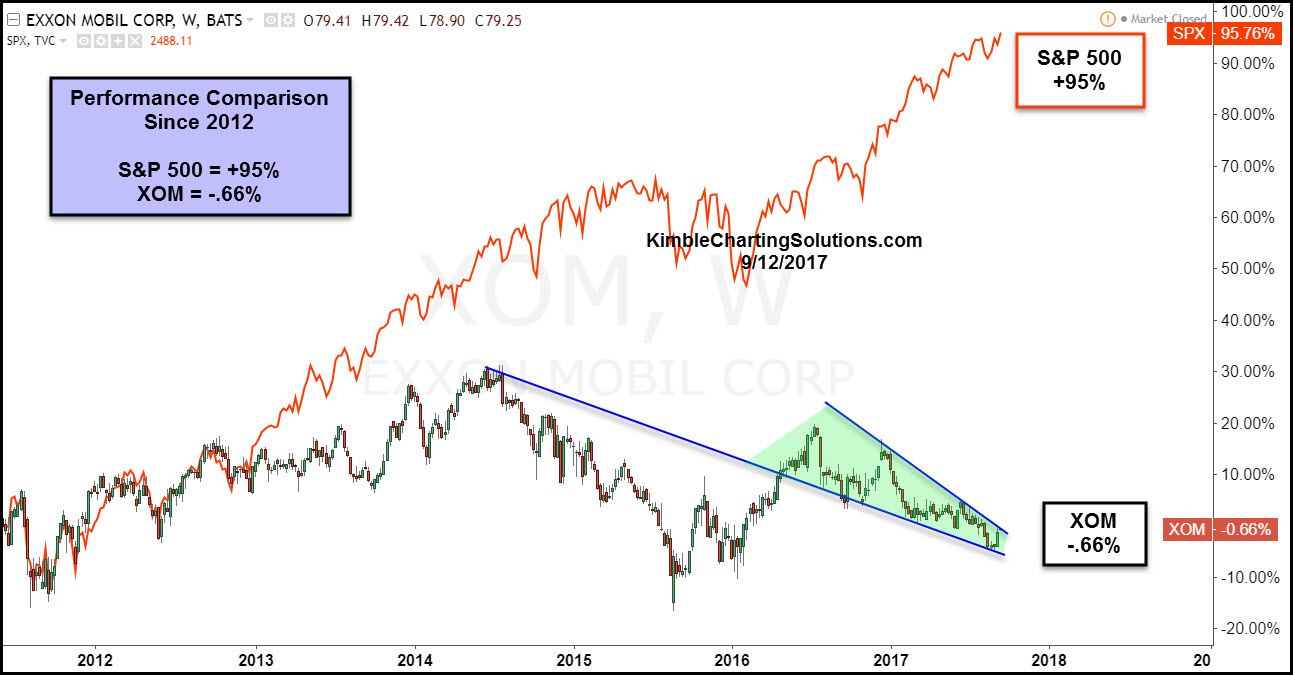
Exxon Mobil (XOM) has little to brag about over the past 6-years, as its performance is flat and it has lagged the S&P 500’s gains by nearly 95% (See Chart Below). If one looks back 10-years, XOM hasn’t made any gains either! Could times be about to change?
CLICK ON CHART TO ENLARGE
Other than collecting a nice dividend, it has been painful to own XOM over the past 6-years and the past decade, as its performance has been flat. Could this lagging performance be about to end? Exxon finds itself testing an important line in the sand below, that could tell us a ton about its future-
CLICK ON CHART TO ENLARGE
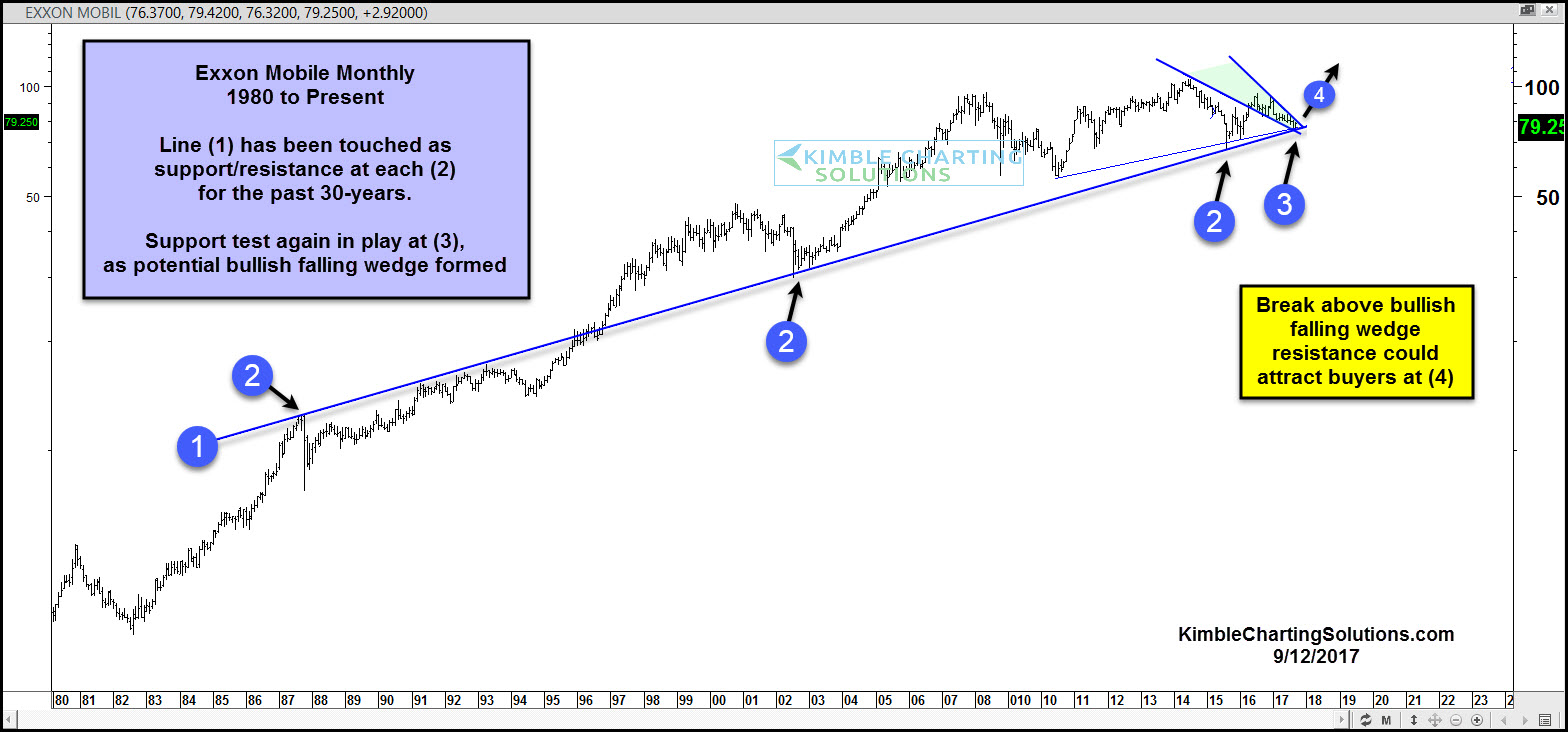
Line (1) has been support/resistance several times at each (2) over the past 30-years. The decline over the past couple of years has XOM testing support line (1) at (3). While testing this line, XOM could be forming a bullish at (3).
The Power of the Pattern is of the opinion that if falling wedge resistance is taken out at (4), it could attract buyers to this out of favor company. A nice risk/reward set up is in play, as (1) becomes a nice stop loss for long positions, should selling pressure take place.
