

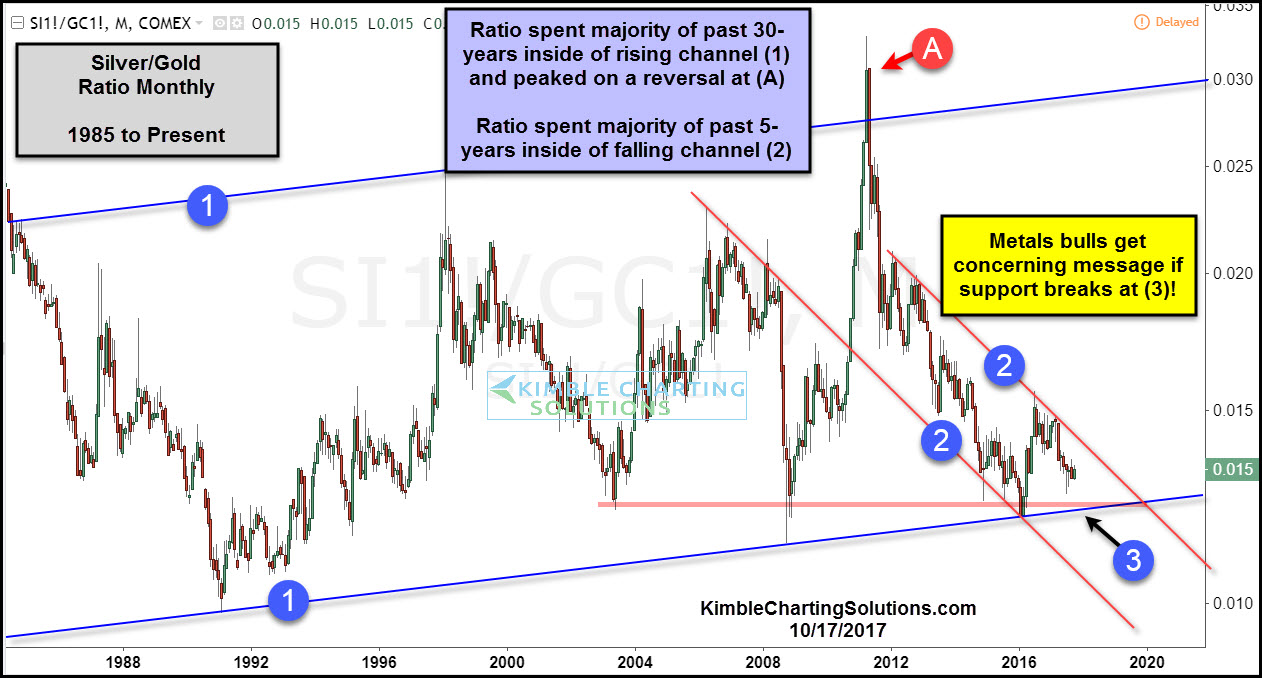
Below looks at the Silver/Gold ratio over the past 30-years. Metals bulls (both Gold & Silver) want to see the ratio moving higher, to send a quality bullish message to both.
The ratio has spent the majority of the past 30-years inside of rising channel (1). When the ratio hit the top of the long-term rising channel back in 2011, the ratio put in a large bearish reversal pattern at (A). This is where both Gold & Silver both started turning weak.
CLICK ON CHART TO ENLARGE
Over the past 5-years, the ratio has created a series of lower highs and lower lows inside of falling channel (2), which is not long-term bullish for the metals. The ratio hit rising support at the start of 2016 and short-term counter-trend rally took place, which took it to the top of its falling channel last summer.
The lows over the past 13-years and rising support (1) come into play at (3), as a dual support test.
Gold & Silver bulls BIG TIME want to see support hold at (3)!!! If support would fail to hold at (3), it would send a long-term concerning message to Gold & Silver bulls. What happens at (3) should send a very important long-term message to the Gold and Silver markets.
