

Keeping a close eye on the ratio of Copper -vs.- Gold can be helpful in determining where interest rates are headed. If the ratio is heading lower (Copper weaker than Gold), often times interest rates will tend to fall. If the ratio is heading higher (Copper stronger than Gold), often times rates will head higher and can suggest the economy is strong and growing.
Below looks at the Doc Copper/Gold ratio over the past 10-years-

CLICK ON CHART TO ENLARGE
Let’s be clear about the intermediate trend in the Copper/Gold ratio…It remains up since the lows at (1), which took place around 14-months ago.
Let’s also be clear about this too…a little decline in the past 6-weeks has not broken the trend.
A reversal pattern (bearish wick) looks to have taken place at (2), which so far hasn’t proven anything. In my humble opinion, what happens at (3), which could be a support test of a bearish rising wedge, is important for the Short-term trend in this ratio. If support would give way as momentum is creating lower highs, some selling pressure could take place in the Copper market.
Below looks at the Inflation indicator (TIP/TLT ratio)-
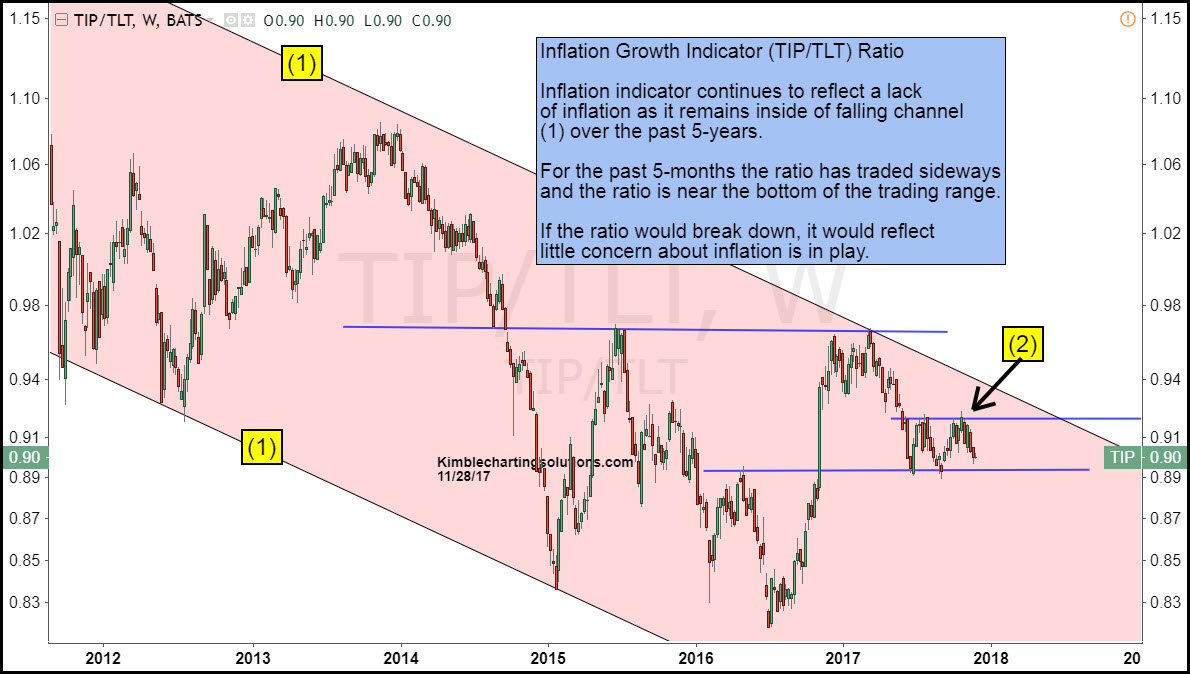
CLICK ON CHART TO ENLARGE
The inflation indicator long-term trend remains lower and the counter-trend rally that started over a year ago hit falling channel resistance at the start of this year and has been heading lower.
With the Copper/Gold ratio and the Inflation ratio both in long-term downtrends, the current support tests by both look to be very important towards letting us know if pressures will continue for interest rates to rise and could tell us a good deal of the economy growing enough to spark inflation concerns.
