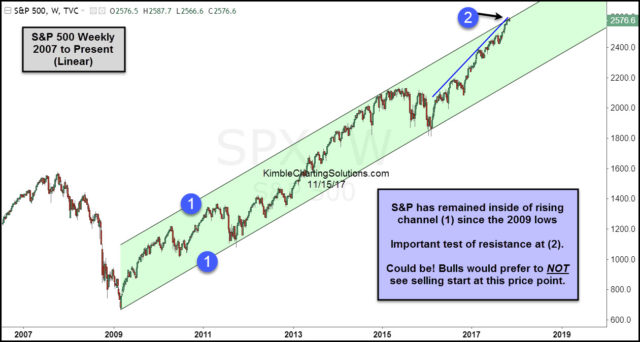
The trend in the S&P 500 remains up, as it is above long-term moving averages and is in a solid rising channel in the chart below. The little bit of softness that has taken place of late has done nothing to change that trend.
The Power of the Pattern wanted to share with you this morning a key test to the bull trend in the chart below-
CLICK ON CHART TO ENLARGE
The S&P has remained inside of quality rising channel (1) since the 2009 lows. The top of the channel was touched back in late 2014, where it then embarked on sideways to downtrend until it testing the bottom of the rising channel in 2016.
The strong rally since testing the bottom of the channel in 2016, now has it testing the top of the channel at (2).
This could be a dangerous channel resistance test for the bulls if selling would start, especially as the number of assets invested in the 2X long S&P ETF is near record highs!


