
![]()
1-year ago this month, the Transports/S&P 500 ratio peaked and has been heading lower, reflecting that Transports have been diverging against the broad market. Below looks at the performance of the S&P to Transportation ETF (IYT)-
![]()
CLICK ON CHART TO ENLARGE
The chart above highlights that IYT and underperformed the S&P 500 by nearly 10% in the past 12-months, with a good deal of underperformance taking place the past few weeks.
Below looks at the pattern of IYT over the past few years-
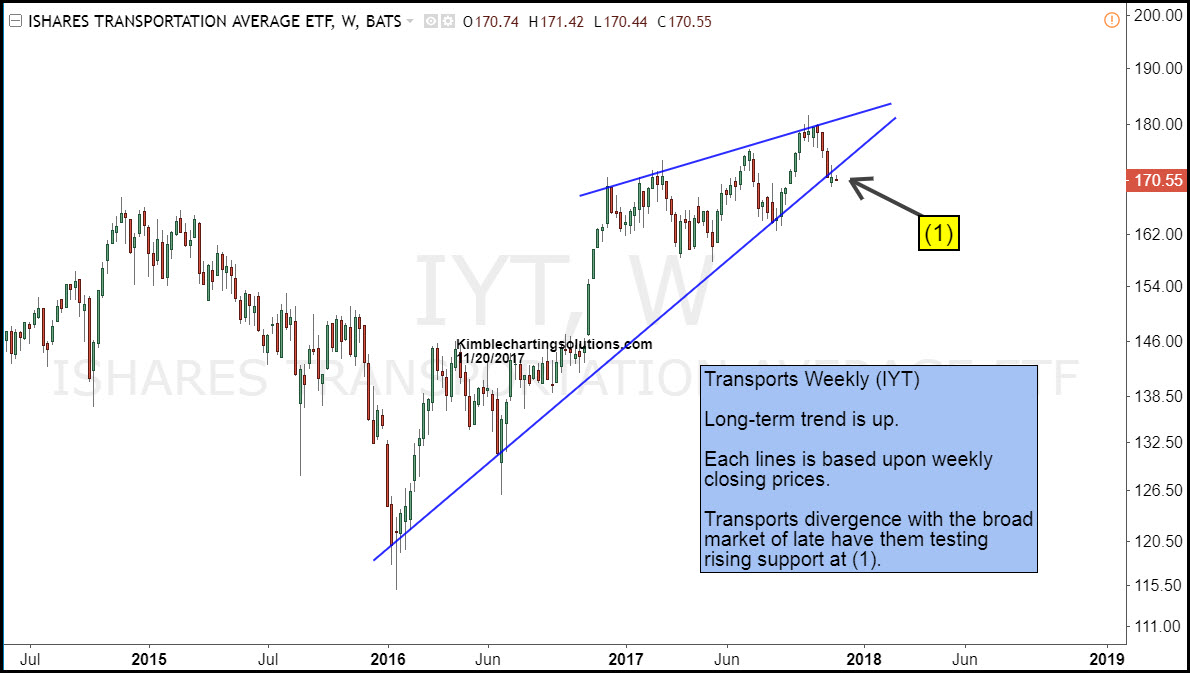
CLICK ON CHART TO ENLARGE
IYT is testing rising support, which could be a support test of a bearish rising wedge pattern. At this time the trend is up, despite the year-long divergence.
What IYT does at (1), could send an important ST message to the key sector. Sometimes in history, how this key sector does, can send an important message to the broad market.
We humbly feel what IYT does at (1), could end up sending an important intermediate message to the sector and the broad market.
